Monitoring Linux system with Grafana
This post shows some examples of how to monitor Linux system with Grafana. I use telegraf to collect data and it sends the collected data to influxdb.
Monitoring disk, RAM and CPU usage
Configure telegraf to collect relevant data
etc/telegraf/telegraf.conf:
# Read metrics about memory usage
[[inputs.mem]]
  # no configuration

# Read metrics about cpu usage
[[inputs.cpu]]
  ## Whether to report per-cpu stats or not
  percpu = true
  ## Whether to report total system cpu stats or not
  totalcpu = true
  ## If true, collect raw CPU time metrics
  collect_cpu_time = false
  ## If true, compute and report the sum of all non-idle CPU states
  report_active = false

# Read metrics about disk usage by mount point
[[inputs.disk]]
  ## By default stats will be gathered for all mount points.
  ## Set mount_points will restrict the stats to only the specified mount points.
  # mount_points = ["/"]

  ## Ignore mount points by filesystem type.
  ignore_fs = ["tmpfs", "devtmpfs", "devfs", "iso9660", "overlay", "aufs", "squashfs"]
Grafana panels
RAM
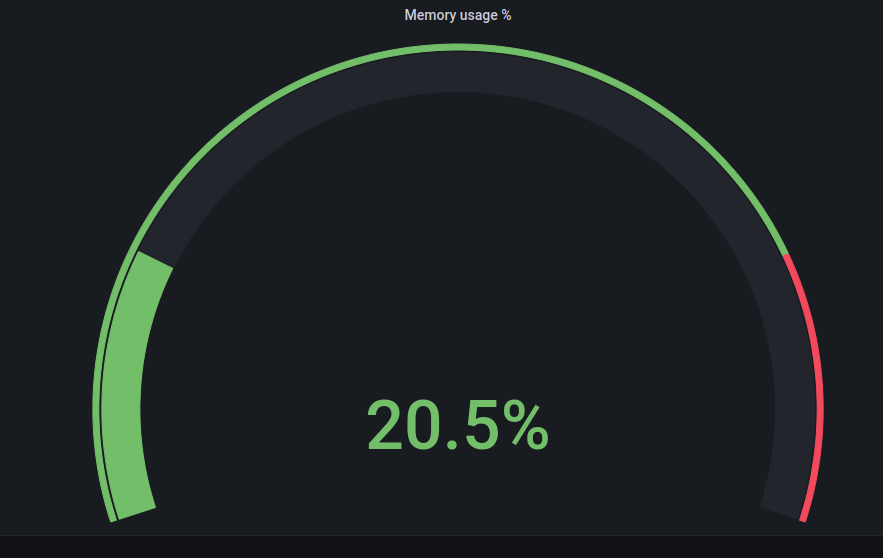
The query I use to get RAM usage in percentage:
from(bucket:"homebucket")|> range(start: -60m)|> filter(fn:(r) => r._measurement == "mem" and r._field == "used_percent" and r.host == "nuc" )
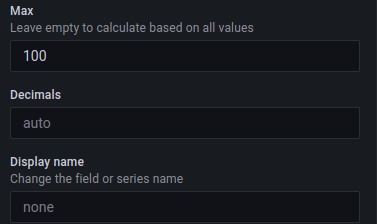
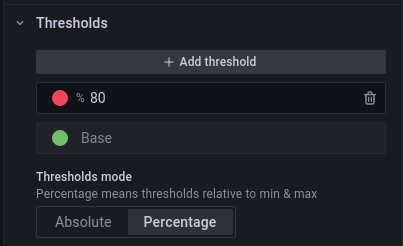
I use the Gauge panel type and configure it with the following options:
The end result is very simple and nice view:
Disk usage
For disk usage I have pretty much the same configuration, but the query is of course a little different (and panel’s title):
from(bucket:"homebucket")
  |> range(start: -1h)
  |> filter(fn: (r) =>
    r._measurement == "disk" and
    r._field == "used_percent" and
    r.host == "nuc"
  )
I know I could have combined RAM and disk usage queries to same panel but this was the way I did my initial setup and have not changed it since as it works well enough.
CPU usage
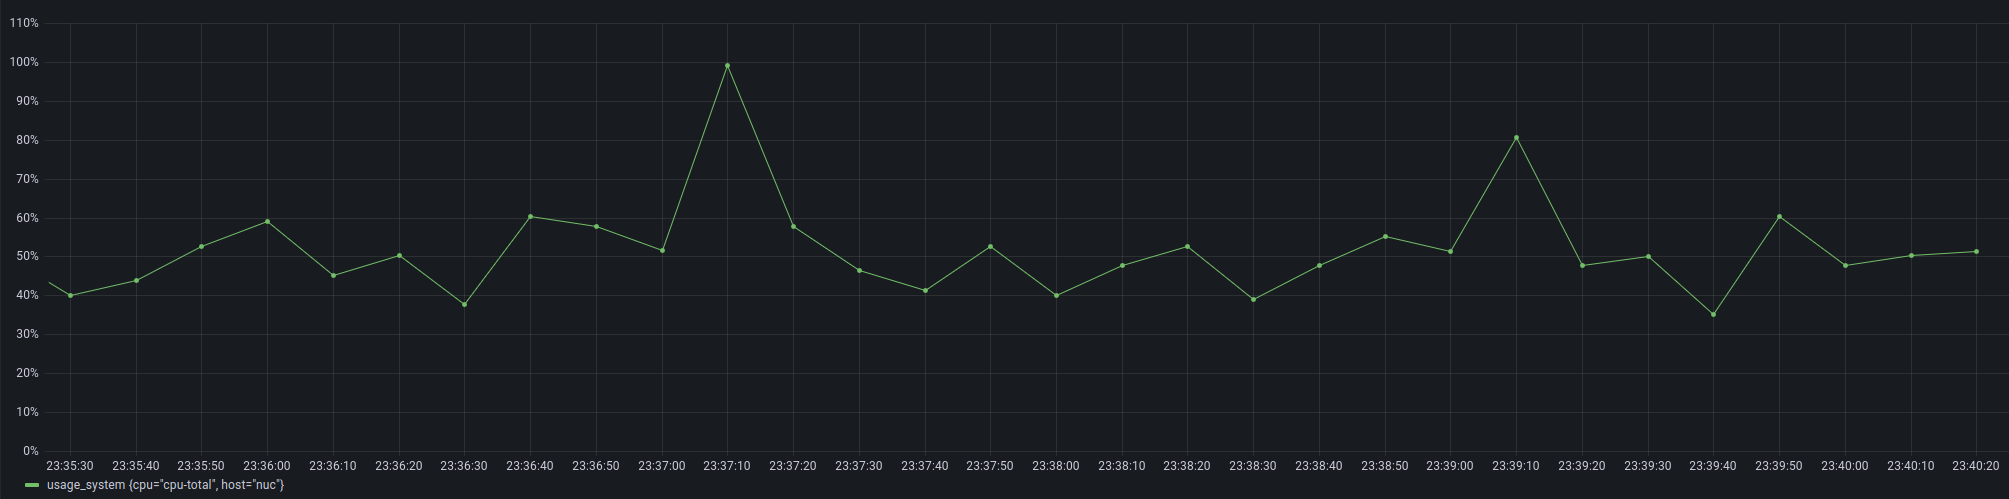
For CPU I use the default Time series panel type and the following query:
from(bucket:"homebucket")
  |> range(start: -15m)
  |> filter(fn: (r) =>
    r._measurement == "cpu" and
    r._field == "usage_system" and
    r.cpu == "cpu-total"
  )
There’s is not really any specific configurations for the panel and the end-result looks like this:
Monitoring systemd services
Configure telegraf to collect systemd data
etc/telegraf/telegraf.conf:
[[inputs.systemd_units]]
  ## Set timeout for systemctl execution
  timeout = "5s"
  #
  ## Filter for a specific unit type, default is "service", other possible
  ## values are "socket", "target", "device", "mount", "automount", "swap",
  ## "timer", "path", "slice" and "scope ":
  unittype = "service"
  #
  ## Filter for a specific pattern, default is "" (i.e. all)
  pattern = "*beat* *falco*"
I have some specific services that I want to monitor and I’m using pattern option to pick those only.
Grafana panel
I use the below query to get service status from the systemd_units data collection.
from(bucket:"homebucket")
  |> range(start: -15m)
  |> filter(fn: (r) =>
    r._measurement == "systemd_units" and
    r._field == "active_code"
  )
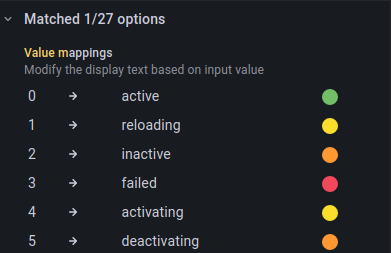
The query gives a number between 0-5 as a result and its meaning is defined in unit_active_state_table:
| Value | Meaning | Description |
|---|---|---|
| 0 | active | unit is ~ |
| 1 | reloading | unit is ~ |
| 2 | inactive | unit is ~ |
| 3 | failed | unit is ~ |
| 4 | activating | unit is ~ |
| 5 | deactivating | unit is ~ |
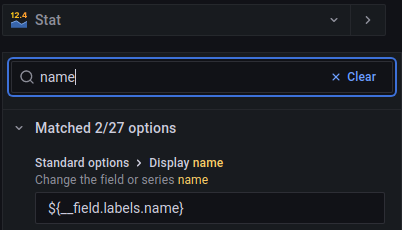
The display name by default has a value like active_code {active="active", host="nuc", load="loaded", name="auditbeat.service", sub="running"}. By setting the display name value and some value mappings I get more readable results to the panel.
This configuration sets “name” as display text from the above dictionary {...}.
This configuration maps integer values from unit_active_state_table to more understandable string values.
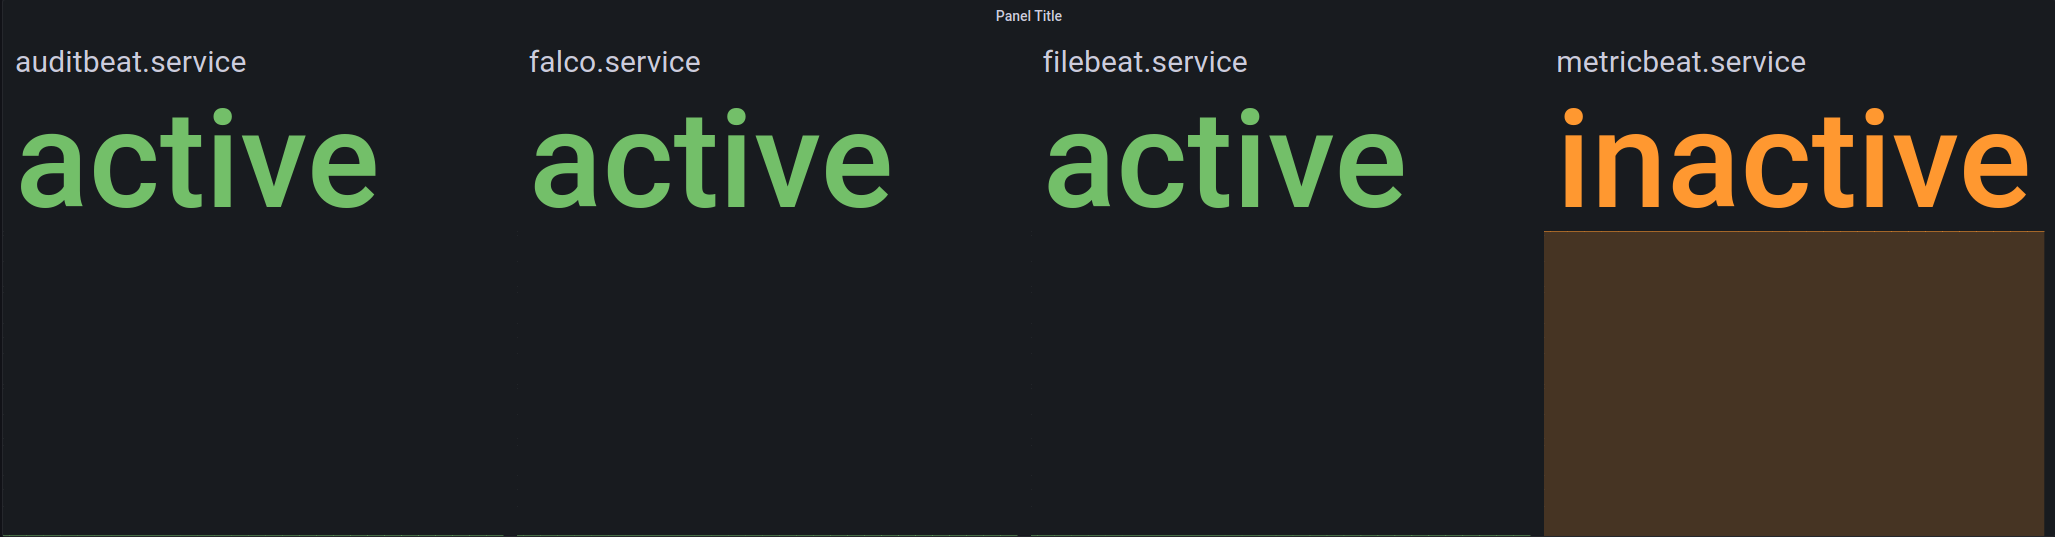
The result is a panel that shows the status of the monitored systemd services.