Training with DetectionLab
This post contains my notes from tinkering with the DetectionLab project.
I am not a professional threat hunter or SOC analyst, but I have worked with matters related to these topics.
With my current knowledge, I don’t dare to say much about threat-hunting workflows or other best practices, so this post will mainly contain some examples and tests with different tools.
The below image gives an overview of DetectionLab’s content (image source)

DetectionLab uses Splunk for log collection, and while I’m more experienced with the ELK stack and even noticed the ELK fork, I wanted to get some basic know-how with Splunk.
Deploying DetectionLab
I used Linux+VirtualBox for the deployment. Everything worked as instructed otherwise, but I had some issues with Velociraptor’s download URL, and as a temporary fix, I just replaced the command that builds the download URL with a static URL You can see the git diff below if you are facing the same issue.
diff --git a/Vagrant/scripts/install-velociraptor.ps1 b/Vagrant/scripts/install-velociraptor.ps1
index deda449..75fafe2 100644
--- a/Vagrant/scripts/install-velociraptor.ps1
+++ b/Vagrant/scripts/install-velociraptor.ps1
@@ -18,7 +18,7 @@ Write-Host "$('[{0:HH:mm}]' -f (Get-Date)) Determining latest release of Velocir
 [Net.ServicePointManager]::SecurityProtocol = [Net.SecurityProtocolType]::Tls12
 # Disabling the progress bar speeds up IWR https://github.com/PowerShell/PowerShell/issues/2138
 $ProgressPreference = 'SilentlyContinue'
-$velociraptorDownloadUrl = "https://github.com" + ((Invoke-WebRequest "https://github.com/Velocidex/velociraptor/releases" -UseBasicParsing).links | Select-Object -ExpandProperty href | Select-String "windows-amd64.msi$" | Select-Object -First 1)
+$velociraptorDownloadUrl = "https://github.com/Velocidex/velociraptor/releases/download/v0.6.7-1/velociraptor-v0.6.7-windows-amd64.msi"
 $velociraptorMSIPath = 'C:\Users\vagrant\AppData\Local\Temp\velociraptor.msi'
 $velociraptorLogFile = 'c:\Users\vagrant\AppData\Local\Temp\velociraptor_install.log'
 If (-not(Test-Path $velociraptorLogFile) -or ($Update -eq $true)) {
Check Velociraptor’s release page and update the latest version to the variable before using this patch.
Resources
- https://www.splunk.com/en_us/blog/security/hunting-with-splunk-the-basics.html
- https://github.com/0x4D31/awesome-threat-detection
- https://www.ibm.com/topics/threat-hunting
- https://www.uhkametsa.fi/ (Finnish podcast)
Splunk and Zeek
Zeek is a passive, open-source network traffic analyzer. Many operators use Zeek as a network security monitor (NSM) to support investigations of suspicious or malicious activity. Zeek also supports a wide range of traffic analysis tasks beyond the security domain, including performance measurement and troubleshooting.
– https://docs.zeek.org/en/master/about.html
Resources
- https://cybersecurity.att.com/blogs/security-essentials/open-source-intrusion-detection-tools-a-quick-overview
- https://www.ericooi.com/zeekurity-zen-zeries/
- JA3:
JA3 is a method for creating SSL/TLS client fingerprints that should be easy to produce on any platform and can be easily shared for threat intelligence. Before using, please read this blog post: TLS Fingerprinting with JA3 and JA3S
Example queries
- Search Log types:
index=* earliest=0
| stats values(sourcetype) by index
Avoid using index=* in production!
Connection Logs
-
Search for everything in specific index:
index=zeek - Search from zeek
connlogs where the destination port is higher than 1024:index=zeek source=/opt/zeek/spool/manager/conn.log id.resp_p>1024 - Same search as as above, but count over service type:
index=zeek source=/opt/zeek/spool/manager/conn.log id.resp_p>1024
| chart count over service
Use Vizualisation tab in search to see some graph results
- Search for top 10 systems acting as event origins:
index=zeek source=/opt/zeek/spool/manager/conn.log
| top id.orig_h
|head 10
- Show the amount of data transferred per system (top 10):
index=zeek source=/opt/zeek/spool/manager/conn.log
| stats values(service) as Service sum(orig_bytes) as B by id.orig_h
| sort -B
| head 10
| eval MB = round(B/1024/1024,2)
| eval GB = round(MB/1024,2)
| rename id.orig_h as Source
| fields Source B MB GB Services
Could be something to look at in data exfiltration situations.
- Search for top 10 destinations based on number of connections:
index=zeek source=/opt/zeek/spool/manager/conn.log id.resp_p>1024
| top id.resp_h
| head 10
- Show the amount of data transferred per destination (top 10):
index=zeek source=/opt/zeek/spool/manager/conn.log
| stats values(service) as Service sum(orig_bytes) as B by id.resp_h
| sort -B
| head 10
| eval MB = round(B/1024/1024,2)
| eval GB = round(MB/1024,2)
| rename id.resp_h as Destination
| fields Destination B MB GB Services
SSL logs
-
Search for everything in ssl log:
index=zeek source=/opt/zeek/spool/manager/ssl.log -
Search for rare JA3 hashes:
index=zeek source=/opt/zeek/spool/manager/ssl.log
| rare ja3
| sort - count
You can google the rare ja3 hashes found and see if anything pops-up.
- Search for events with specific
ja3hash:index=zeek source=/opt/zeek/spool/manager/ssl.log ja3=f436b9416f37d134cadd04886327d3e8
This hash, for example, was generated from a event like this:
{
  "ts": 1669901963.912314,
  "uid": "Cr6xE82xV5Rki3QvFb",
  "id.orig_h": "10.0.2.15",
  "id.orig_p": 38924,
  "id.resp_h": "143.198.59.212",
  "id.resp_p": 443,
  "version": "TLSv13",
  "cipher": "TLS_AES_256_GCM_SHA384",
  "curve": "x25519",
  "server_name": "ping.detectionlab.network",
  "resumed": false,
  "last_alert": "certificate_expired",
  "established": false,
  "ssl_history": "CsiL",
  "ja3": "f436b9416f37d134cadd04886327d3e8",
  "ja3s": "15af977ce25de452b96affa2addb1036"
}
So, Detection Lab calls home ? ("server_name": "ping.detectionlab.network")
DNS Logs
- Search for everythin in dns logs:
index=zeek source=/opt/zeek/spool/manager/dns.log - Search for top destionation hosts (
id.resp_h), i.e, top DNS servers:
index=zeek source=/opt/zeek/spool/manager/dns.log
| chart count by id.resp_h
| sort - count
| head 10
- Search for top source hosts (
id.orig_h):
index=zeek source=/opt/zeek/spool/manager/dns.log
| chart count by id.orig_h
| sort - count
| head 10
Peak in here with one host could be indication of DNS tunneling.
- Search for big queries:
index=zeek source=/opt/zeek/spool/manager/dns.log
| eval query_length = len(query)
| where query_length > 100
| table _time id.orig_h id.resp_h proto query query_length answer
You can try to figure out your environment’s average query sizes and create a dashboard for queries larger than average. The same approach applies to many things. By learning what is normal in your environment allows you to spot anomalies.
- Try to find some potential beacons: (Inspiration)
index=zeek source=/opt/zeek/spool/manager/dns.log
| fields _time, id.orig_h, query
| streamstats current=f last(_time) as last_time by query
| eval gap=last_time - _time
| stats count dc(id.orig_h) AS NumHosts avg(gap) AS AverageBeaconTime var(gap) AS VarianceBeaconTime BY query
| eval AverageBeaconTime=round(AverageBeaconTime,3), VarianceBeaconTime=round(VarianceBeaconTime,3)
| sort –count
| where VarianceBeaconTime < 60 AND AverageBeaconTime > 0
- Find domains with more than ten subdomains:
index=zeek source=/opt/zeek/spool/manager/dns.log query="*"
| rex field=query "^(?<subdomain>([a-zA-Z0-9]+\.)+)(?<domain>[a-zA-Z0-9]+\.[a-zA-Z0-9]+)$"
| stats dc(subdomain) AS HostsPerDomain BY domain
| sort -HostsPerDomain
| where HostsPerDomain > 10
Example results:
| domain | HostsPerDomain |
|---|---|
| test.local | 192 |
- List subdomains from such a domains:
index=zeek source=/opt/zeek/spool/manager/dns.log query="*"
| rex field=query "^(?<subdomain>([a-zA-Z0-9]+\.)+)(?<domain>[a-zA-Z0-9]+\.[a-zA-Z0-9]+)$"
| eventstats dc(subdomain) AS HostsPerDomain BY domain
| where HostsPerDomain > 10
| dedup subdomain, domain
| table domain, subdomain
Example results:
| domain | subdomain |
|---|---|
| test.local | t24yu0jices1tkvcagjqz0dvb3bqejq2cup3zfl2wmg. |
| test.local | ou85aghuemvmtndruznfd2k5r3g3thjwz29vbtzjc1q. |
| test.local | bgxst041a1nhm29zttnruunjrmpyv1o4zg5fvvzrr0i. |
| test.local | c3pec1dbutdguesxa0juog5qndjunvl5uxa1zw9hees. |
| test.local | bvzku0z3m2s1eew2cnf1n2f2ouras2xpcfn0dwnhmvo. |
| test.local | qurwunlwtvruztz0qju4u3pynxbtrudxmjryy3k2r2q. |
| test.local | uedmuldbsg5bcglln0pmctn2qnj1nglytktrtgl4ota. |
| test.local | edjowe9zzzjktm12bwxntehmwgzfdwdxowl4cm8xtgi. |
| test.local | bg1bnxzrnmj3befedhhbegv1y1pnoen2dmhssdi2nta. |
| test.local | rkfnmnnwqxvxunvybg5suhbhyk5lbvhjwekwn3den1u. |
| test.local | dnhjtmtjdnhwnu12bxfxdudoagxmtxrutljgdgvkowq. |
| test.local | t1lts1r3settc2dxbe5mm3fcyknlwm5jrxhzeedoqzg. |
Splunk and Suricata
Because Suricata acts based on the rules it has configured, a good starting point is to check what rules and configurations it has by default in DetectionLab.
From your Logger host (ssh vagrant@192.168.56.105), check the /var/lib/suricata/rules/ directory and /etc/suricata/suricata.yaml configuration file.
DetectionLab’s documentation also has an example curl command that can be used to generate some quick alerts. There also seems to be a few alerts related to WinRM after the basic deployment.
Example queries
- Search for all alerts:
index="suricata"
|table timestamp alert.action alert.signature src_ip dest_ip src_port dest_port
Example results:
| timestamp | alert.action | alert.signature | src_ip | dest_ip | src_port | dest_port |
|---|---|---|---|---|---|---|
| 2022-12-03T15:29:08.336396+0000 | allowed | ET USER_AGENTS WinRM User Agent Detected - Possible Lateral Movement | 192.168.56.102 | 192.168.56.103 | 65396 | 5985 |
| 2022-12-03T15:29:04.276235+0000 | allowed | ET USER_AGENTS WinRM User Agent Detected - Possible Lateral Movement | 192.168.56.102 | 192.168.56.103 | 65396 | 5985 |
| 2022-12-03T15:29:04.274138+0000 | allowed | ET USER_AGENTS WinRM User Agent Detected - Possible Lateral Movement | 192.168.56.102 | 192.168.56.103 | 65396 | 5985 |
| 2022-12-03T15:29:04.272064+0000 | allowed | ET USER_AGENTS WinRM User Agent Detected - Possible Lateral Movement | 192.168.56.102 | 192.168.56.103 | 65396 | 5985 |
| 2022-12-03T15:29:04.270103+0000 | allowed | ET USER_AGENTS WinRM User Agent Detected - Possible Lateral Movement | 192.168.56.102 | 192.168.56.103 | 65396 | 5985 |
- Search for alerts but deduplicate based on some of the fields:
index="suricata"
|dedup alert.signature src_ip dest_ip dest_port
|table timestamp alert.action alert.signature src_ip dest_ip src_port dest_port
Testing rules
Nmap OS detection scan.
- Add path for a new rule file in suricata.yaml:
rule-files:
  - suricata.rules
  - custom.rules
- Get the biggest SID value from the current rule set:
grep -hPo 'sid:\K\d+' /var/lib/suricata/rules/*|sort -n -u|tail -n 1
- Add new rule to
/var/lib/suricata/rules/custom.rules
Use the biggest sid number + 1 to avoid duplicate signatures.
alert udp $HOME_NET 10000: -> $HOME_NET 10000: (msg:"ET SCAN NMAP OS Detection Probe"; dsize:300; content:"CCCCCCCCCCCCCCCCCCCC"; fast_pattern; content:"CCCCCCCCCCCCCCCCCCCCCCCCCCCCCCCCCCCCCCCCCCCCCCCCCCCCCCCCCCCCCCCCCCCCCCCCCCCCCCCCCCCCCCCCCCCCCCCCCCCCCCCCCCCCCCCCCCCCCCCCCCCCCCCCCCCCCCCCCCCCCCCCCCCCCCCCCCCCCCCCCCCCCCCCCCCCCCCCCCCCCCCCCCCCCCCCCCCCCCCCCCCCCCCCCCCCCCCCCCCCCCCCCCCCCCCCCCCCCCCCCCCCCCCCCCCCCCC"; depth:255; content:"CCCCCCCCCCCCCCCCCCCCCCCCCCCCCCCCCCCCCCCCCCCCC"; within:45; classtype:attempted-recon; sid:2527012; rev:4; metadata:created_at 2014_05_21, updated_at 2019_10_08;)
This rule is direct copy from the default rules, but it’s intentionally set against HOME_NET -> HOME_NET connections to allow testing Nmap scans between two lab hosts. Most of the default rules don’t focus on traffic within the “HOME_NET”.
- Restart suricata:
sudo systemctl restart suricata - Check for errors:
sudo journalctl -u suricata|grep -P '(custom.rules|files processed)' - Install Nmap to logger:
sudo apt install nmap -y - Run OS detection against Win10 host with Nmap:
sudo nmap -O 192.168.56.104 -v - Search in splunk:
index="suricata" alert.signature="*NMAP*"
|dedup alert.signature src_ip dest_ip
|table timestamp alert.action alert.signature src_ip dest_ip src_port dest_port
Example results:
| timestamp | alert.action | alert.signature | src_ip | dest_ip | src_port | dest_port |
|---|---|---|---|---|---|---|
| 2022-12-03T16:02:43.421538+0000 | allowed | ET SCAN NMAP OS Detection Probe | 192.168.56.105 | 192.168.56.104 | 56270 | 36858 |
RDP connections
- Add the following rule and ensure that sid is not a duplicate:
alert tcp $HOME_NET any -> $HOME_NET 3389 (msg:"RDP connection"; flow:established,to_server; sid:2527013;)
A better rule would most likely be a one like below which would catch RDP connections in non-standard ports, but plain TCP connection with netcat would not trigger it, so I’m using the one above for testing.
alert rdp $HOME_NET any -> $HOME_NET any (msg:"RDP connection"; flow:established,to_server; sid:2527013;)
- Restart suricata
- Establish TCP connection to port 3389 of Win10 host:
nc -v 192.168.56.104 3389 - Search in Splunk:
index="suricata" alert.signature="RDP connection"
|table timestamp alert.action alert.signature src_ip dest_ip src_port dest_port
Example result:
| timestamp | alert.action | alert.signature | src_ip | dest_ip | src_port | dest_port |
|---|---|---|---|---|---|---|
| 2022-12-03T16:54:25.650497+0000 | allowed | RDP connection | 192.168.56.105 | 192.168.56.104 | 46164 | 3389 |
| 2022-12-03T16:50:59.957913+0000 | allowed | RDP connection | 192.168.56.105 | 192.168.56.104 | 46164 | 3389 |
Splunk and Sysmon
System Monitor (Sysmon) is a Windows system service and device driver that, once installed on a system, remains resident across system reboots to monitor and log system activity to the Windows event log. It provides detailed information about process creations, network connections, and changes to file creation time. By collecting the events it generates using Windows Event Collection or SIEM agents and subsequently analyzing them, you can identify malicious or anomalous activity and understand how intruders and malware operate on your network.
– https://learn.microsoft.com/en-us/sysinternals/downloads/sysmon
Resources
- Sysmon event ids
- https://github.com/olafhartong/sysmon-modular
- https://github.com/SwiftOnSecurity/sysmon-config
Example queries
- Search for everything in sysmon index:
index="sysmon" - Search for events of specific host:
index="sysmon" host="win10.windomain.local" - Show stats of DNS related events by an executable (
Image) for the last day(-1d):
For specific host:
index="sysmon" host="win10.windomain.local" earliest=-1d EventCode=22
| stats count by QueryName Image
Example results:
| QueryName | Image | count |
|---|---|---|
| wpad | C:\Windows\System32\svchost.exe | 3 |
| windomain.local | C:\Windows\System32\svchost.exe | 1 |
| win10.windomain.local | C:\Windows\System32\svchost.exe | 1 |
| win10 | C:\Windows\system32\lsass.exe | 1 |
| win10 | C:\Windows\System32\svchost.exe | 1 |
For all hosts:
index="sysmon" earliest=-1d EventCode=22
| stats count by QueryName Image ComputerName
- Find PowerShell related events:
index="sysmon" host="win10.windomain.local" Image="*powershell*" - Find file creation operations related to PowerShell usage:
index="sysmon" host="win10.windomain.local" Image="*powershell*" EventCode=11
| table _time host Image TargetFilename
Example results:
| _time | host | Image | TargetFilename |
|---|---|---|---|
| 2022-12-02 12:00:01 | win10.windomain.local | C:\Windows\System32\WindowsPowerShell\v1.0\powershell.exe | C:\Windows\System32\config\systemprofile\AppData\Local\Microsoft\Windows\PowerShell\StartupProfileData-NonInteractive |
| 2022-12-02 11:00:03 | win10.windomain.local | C:\Windows\System32\WindowsPowerShell\v1.0\powershell.exe | C:\Windows\Temp__PSScriptPolicyTest_2owtty03.jwz.psm1 |
| 2022-12-01 15:13:12 | win10.windomain.local | C:\Windows\System32\WindowsPowerShell\v1.0\powershell.exe | C:\Windows\System32\config\systemprofile\AppData\Local\Microsoft\Windows\PowerShell\ModuleAnalysisCache |
| 2022-12-01 15:13:04 | win10.windomain.local | C:\Windows\System32\WindowsPowerShell\v1.0\powershell.exe | C:\Users\vagrant\AppData\Local\Microsoft\Windows\PowerShell\StartupProfileData-NonInteractive |
| 2022-12-01 15:13:04 | win10.windomain.local | C:\Windows\System32\WindowsPowerShell\v1.0\powershell.exe | C:\Users\vagrant\AppData\Local\Temp__PSScriptPolicyTest_s3ekafkq.5eh.ps1 |
| 2022-12-01 15:12:59 | win10.windomain.local | C:\Windows\System32\WindowsPowerShell\v1.0\powershell.exe | C:\Users\vagrant\AppData\Local\Microsoft\Windows\PowerShell\StartupProfileData-NonInteractive |
| 2022-12-01 15:12:58 | win10.windomain.local | C:\Windows\System32\WindowsPowerShell\v1.0\powershell.exe | C:\Windows\Temp__PSScriptPolicyTest_vugwnyp3.5st.psm1 |
| 2022-12-01 15:12:58 | win10.windomain.local | C:\Windows\System32\WindowsPowerShell\v1.0\powershell.exe | C:\Program Files\AutorunsToWinEventLog\AutorunsToWinEventLog.ps1 |
| 2022-12-01 15:12:57 | win10.windomain.local | C:\Windows\System32\WindowsPowerShell\v1.0\powershell.exe | C:\Program Files\AutorunsToWinEventLog\Autorunsc64.exe |
| 2022-12-01 15:12:55 | win10.windomain.local | C:\Windows\System32\WindowsPowerShell\v1.0\powershell.exe | C:\Users\vagrant\AppData\Local\Temp__PSScriptPolicyTest_0zsg5ben.kkn.ps1 |
| 2022-12-01 15:12:51 | win10.windomain.local | C:\Windows\System32\WindowsPowerShell\v1.0\powershell.exe | C:\Users\vagrant\AppData\Local\Microsoft\Windows\PowerShell\StartupProfileData-NonInteractive |
| 2022-12-01 15:12:40 | win10.windomain.local | C:\Windows\System32\WindowsPowerShell\v1.0\powershell.exe | C:\Users\vagrant\AppData\Local\Temp__PSScriptPolicyTest_ssyc1inc.44i.ps1 |
| 2022-12-01 15:12:33 | win10.windomain.local | C:\Windows\System32\WindowsPowerShell\v1.0\powershell.exe | C:\Users\vagrant\AppData\Local\Microsoft\Windows\PowerShell\StartupProfileData-NonInteractive |
- Searching file related events without any specific event ID:
index="sysmon" host="win10.windomain.local" Image="*powershell*" TargetFilename="*"
| table _time host Image TargetFilename
Velociraptor could be used to retrieve file(s) that look interesting.
- Search for strings in
CommandLine:index="sysmon" host="win10.windomain.local" CommandLine="*whoami*" - Search for PowerShell events launched by Velociraptor:
index="sysmon" host="win10.windomain.local" Image="*powershell*" CommandLine="*" ParentImage="C:\\Program Files\\Velociraptor\\Velociraptor.exe" - Search for PowerShell events, except ones launched by Velociraptor:
index="sysmon" host="win10.windomain.local" Image="*powershell*" CommandLine="*" NOT ParentImage="C:\\Program Files\\Velociraptor\\Velociraptor.exe"
Splunk and Windows Event Logs
Example queries
- Search for credential validation events:
index="wineventlog" EventCode=4776 host="*" source="WinEventLog:Security"
| rex field=Message "Logon Account:	(?<Account>[a-zA-Z0-9-.@]+)"
| table ComputerName,Account,Keywords
OS query and Fleet
osquery is an operating system instrumentation framework for Windows, OS X (macOS), and Linux. The tools make low-level operating system analytics and monitoring both performant and intuitive.
osquery exposes an operating system as a high-performance relational database. This allows you to write SQL queries to explore operating system data. With osquery, SQL tables represent abstract concepts such as running processes, loaded kernel modules, open network connections, browser plugins, hardware events or file hashes.
– https://osquery.readthedocs.io/en/latest/
Fleet is the lightweight, open source telemetry platform for servers and workstations. Deploy osquery with Fleet to get comprehensive, customizable data from all your devices and operating systems – without the downtime risk.
– https://github.com/fleetdm/fleet
Example queries
Doing queries is quite simple if you are comfortable with SQL. The installation contains bunch of example queries, and you can find many examples online.
Some query resources:
- https://rhq.reconinfosec.com/
- https://github.com/Cisco-Talos/osquery_queries.
- https://github.com/teoseller/osquery-attck
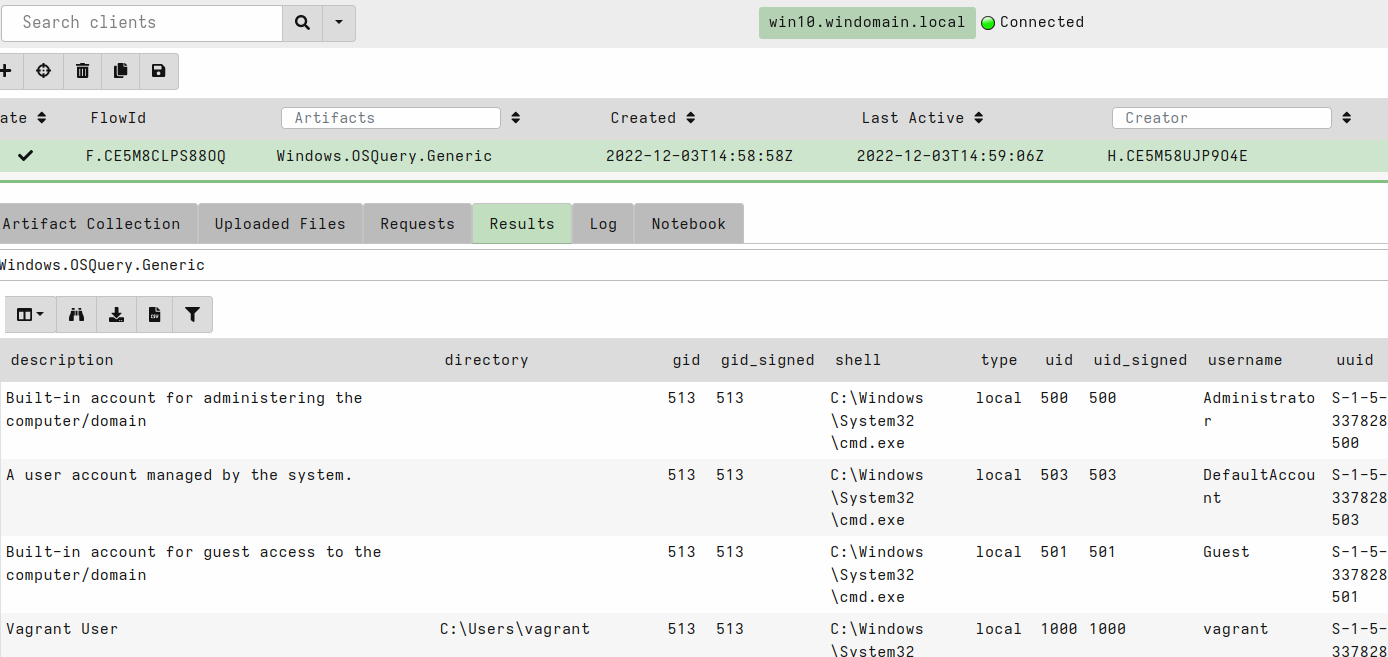
The ability to query registry keys from Windows hosts is a really nice feature. If some malware or exploit is known to add, edit, or delete a registry key, it is possible to search for those modifications. Below is some query examples:
- Search for SMB signing related registry keys:
SELECT * FROM registry WHERE (path='HKEY_LOCAL_MACHINE\\System\CurrentControlSet\Services\LanManServer\Parameters\enablesecuritysignature' or path='HKEY_LOCAL_MACHINE\\System\CurrentControlSet\Services\LanManServer\Parameters\requiresecuritysignature')
Example result:
| host_display_name | data | key | mtime | name | path | type |
|---|---|---|---|---|---|---|
| DC | 1 | HKEY_LOCAL_MACHINE\\System\CurrentControlSet\Services\LanManServer\Parameters | 1669903047 | enablesecuritysignature | HKEY_LOCAL_MACHINE\\System\CurrentControlSet\Services\LanManServer\Parameters\enablesecuritysignature | REG_DWORD |
| WEF | 0 | HKEY_LOCAL_MACHINE\\System\CurrentControlSet\Services\LanManServer\Parameters | 1630990678 | enablesecuritysignature | HKEY_LOCAL_MACHINE\\System\CurrentControlSet\Services\LanManServer\Parameters\enablesecuritysignature | REG_DWORD |
| WIN10 | 0 | HKEY_LOCAL_MACHINE\\System\CurrentControlSet\Services\LanManServer\Parameters | 1552971217 | enablesecuritysignature | HKEY_LOCAL_MACHINE\\System\CurrentControlSet\Services\LanManServer\Parameters\enablesecuritysignature | REG_DWORD |
| DC | 1 | HKEY_LOCAL_MACHINE\\System\CurrentControlSet\Services\LanManServer\Parameters | 1669903047 | requiresecuritysignature | HKEY_LOCAL_MACHINE\\System\CurrentControlSet\Services\LanManServer\Parameters\requiresecuritysignature | REG_DWORD |
| WEF | 0 | HKEY_LOCAL_MACHINE\\System\CurrentControlSet\Services\LanManServer\Parameters | 1630990678 | requiresecuritysignature | HKEY_LOCAL_MACHINE\\System\CurrentControlSet\Services\LanManServer\Parameters\requiresecuritysignature | REG_DWORD |
| WIN10 | 1 | HKEY_LOCAL_MACHINE\\System\CurrentControlSet\Services\LanManServer\Parameters | 1552971217 | requiresecuritysignature | HKEY_LOCAL_MACHINE\\System\CurrentControlSet\Services\LanManServer\Parameters\requiresecuritysignature | REG_DWORD |
- Search for some autorun related keys:
SELECT key,name,type,data FROM registry WHERE key='HKEY_LOCAL_MACHINE\Software\Microsoft\Windows\CurrentVersion\Run' or key like 'HKEY_USERS\%\Software\Microsoft\Windows\CurrentVersion\Run';
Example result:
| host_display_name | data | key | name | type |
|---|---|---|---|---|
| WIN10 | "C:\Program Files\Classic Shell\ClassicStartMenu.exe" -autorun | HKEY_LOCAL_MACHINE\Software\Microsoft\Windows\CurrentVersion\Run | Classic Start Menu | REG_SZ |
| WIN10 | C:\Windows\SysWOW64\OneDriveSetup.exe /thfirstsetup | HKEY_USERS\S-1-5-19\Software\Microsoft\Windows\CurrentVersion\Run | OneDriveSetup | REG_SZ |
| WIN10 | C:\Windows\SysWOW64\OneDriveSetup.exe /thfirstsetup | HKEY_USERS\S-1-5-20\Software\Microsoft\Windows\CurrentVersion\Run | OneDriveSetup | REG_SZ |
| WIN10 | %windir%\system32\SecurityHealthSystray.exe | HKEY_LOCAL_MACHINE\Software\Microsoft\Windows\CurrentVersion\Run | SecurityHealth | REG_EXPAND_SZ |
| WIN10 | C:\tmp\evil.exe | HKEY_USERS\S-1-5-21-3409254358-3337828085-1970278178-1000\Software\Microsoft\Windows\CurrentVersion\Run | Testi | REG_SZ |
| WIN10 | %SystemRoot%\system32\VBoxTray.exe | HKEY_LOCAL_MACHINE\Software\Microsoft\Windows\CurrentVersion\Run | VBoxTray | REG_EXPAND_SZ |
| WIN10 | "%ProgramFiles%\Windows Defender\MSASCuiL.exe" | HKEY_LOCAL_MACHINE\Software\Microsoft\Windows\CurrentVersion\Run | WindowsDefender | REG_EXPAND_SZ |
| WIN10 | wscript "c:\Program Files\sysinternals\bginfo.vbs" | HKEY_LOCAL_MACHINE\Software\Microsoft\Windows\CurrentVersion\Run | bginfo | REG_SZ |
Velociraptor
Velociraptor is a unique, advanced open-source endpoint monitoring, digital forensic and cyber response platform.
It was developed by Digital Forensic and Incident Response (DFIR) professionals who needed a powerful and efficient way to hunt for specific artifacts and monitor activities across fleets of endpoints.
– https://docs.velociraptor.app/docs/overview/
VFS and Shell
There are some interesting things you can do even before using hunts. Velociraptor’s GUI contains a virtual filesystem (VFS) which can be used to browse through clients’ filesystem. It can also be used to browse through registry with Windows hosts.
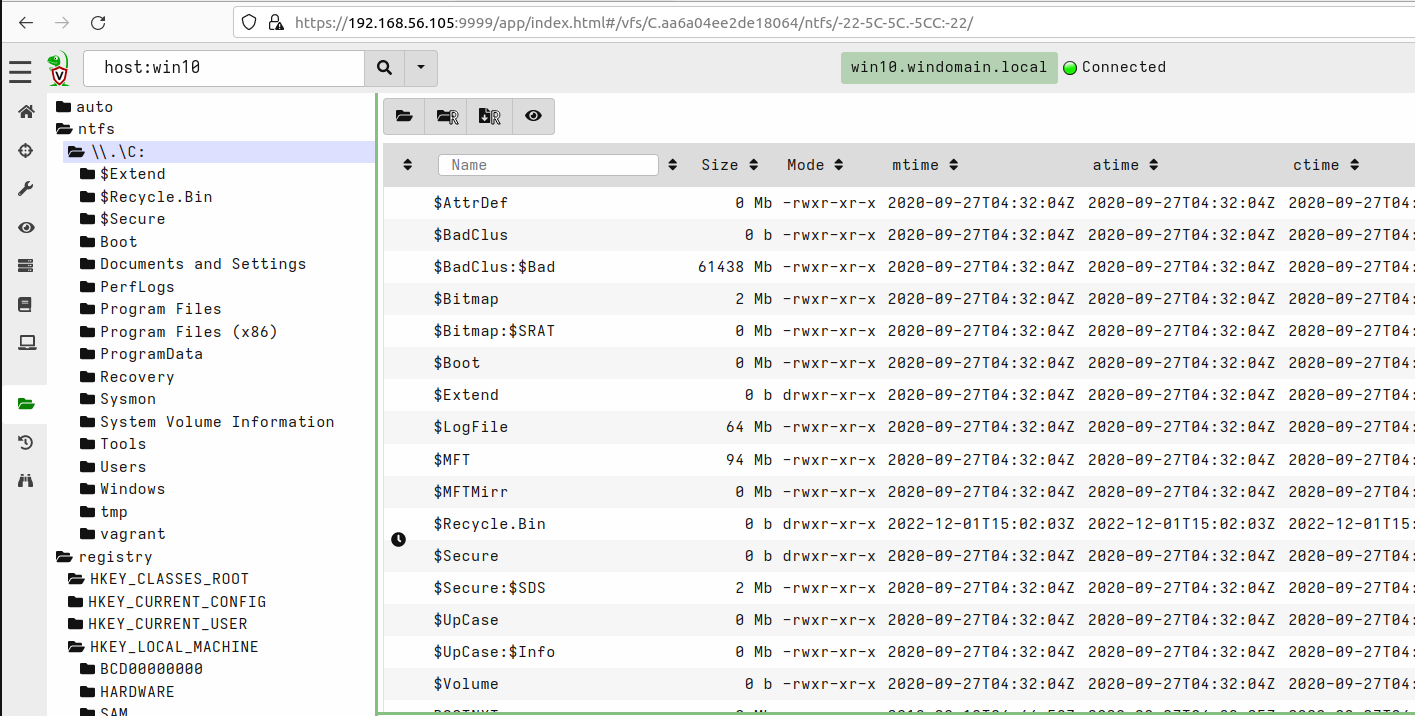
Note that you may need to refresh VFS content if you are checking a client’s VFS for a first time and everything is empty under the top-level directories. You can use the directory buttons shown below to refresh only the current directory, or refresh recursively from the current directory.

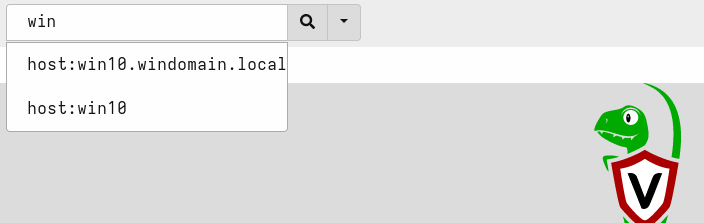
To access specific client’s details just start typing client’s name to search bar and select the wanted host.
Velociraptor also provides direct shell access to clients. After selecting a client, select >_Shell from the menu icons. Then select the shell type, like PowerShell or Cmd, and launch commands.
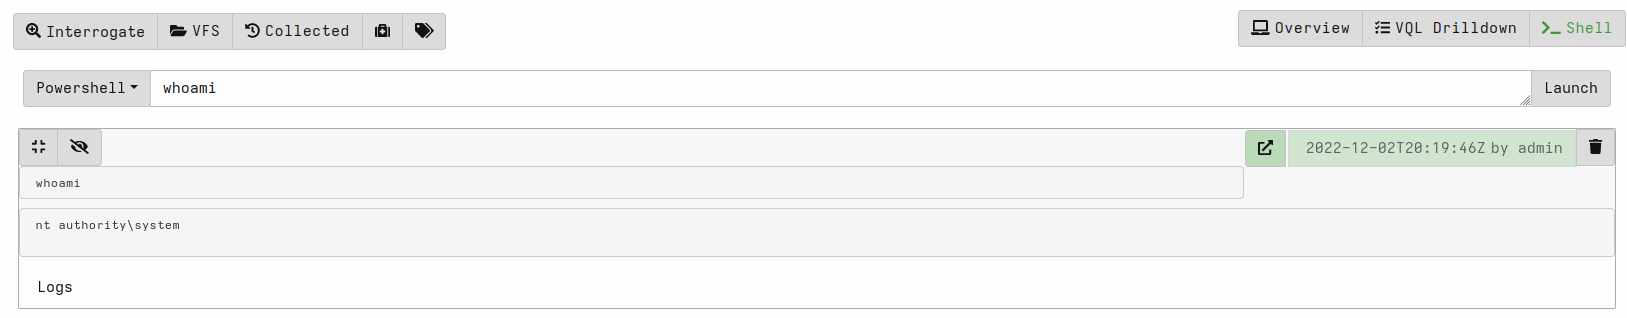
Note that you need to press the eye icon to see the output.
Hunts
Hunts are Velociraptor’s killer feature. With hunts you select one or more artifacts to be executed on target hosts.
Artifacts technically define what type of data you want to collect. Though, not all artifacts are static data collection. For example, there are artifacts that allow executing arbitrary commands.
Velociraptor installation comes with bunch of different artifacts, but you can also create your own artifacts
The basic workflow for setting up a hunt:
- Select “Hunt Manager” from menu options (the bullseye icon).
- Create a new hunt by pressing the plus icon.
- Set Description and other fields based on the hunt you want to create. For example:
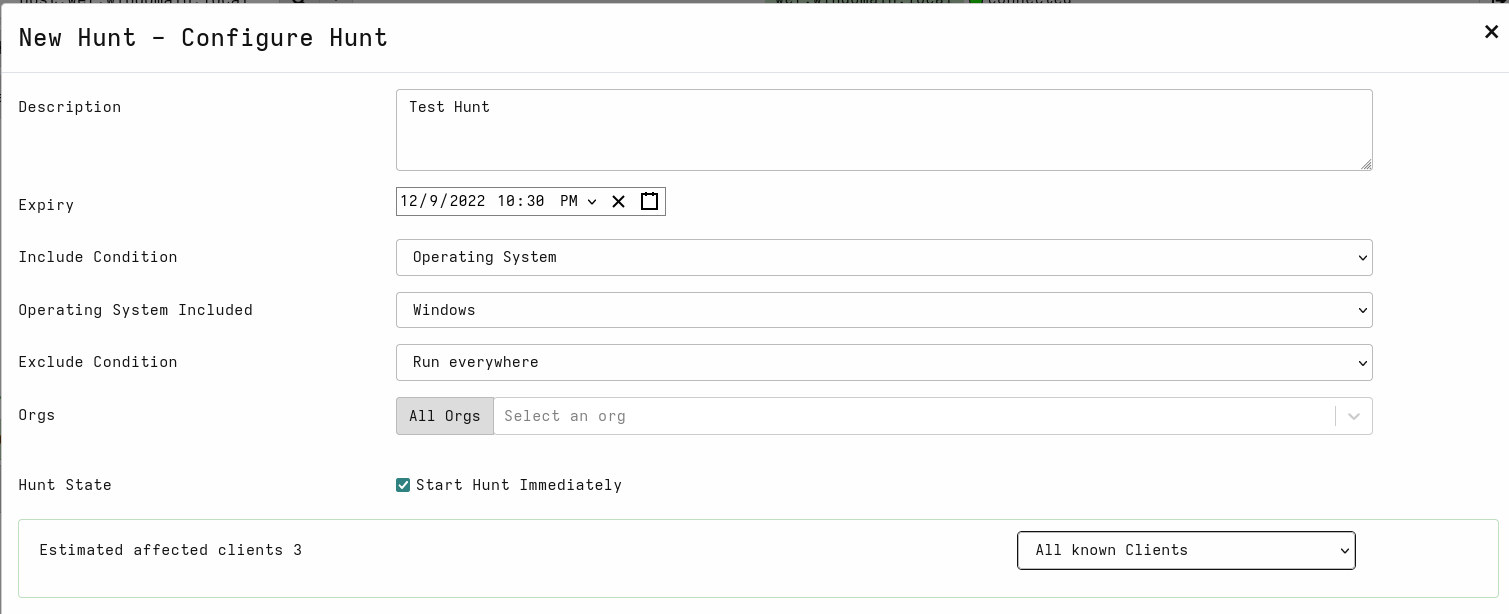 You may be wondering about the expiry time. My understanding for this is that each artifact is only executed once per host, but in a case where new hosts appear while the hunt is still active, those hosts are also included, unless not excluded by some condition.
You can test this by powering down one of the Windows hosts, start hunt, and then power on the host while the hunt is still running.
You may be wondering about the expiry time. My understanding for this is that each artifact is only executed once per host, but in a case where new hosts appear while the hunt is still active, those hosts are also included, unless not excluded by some condition.
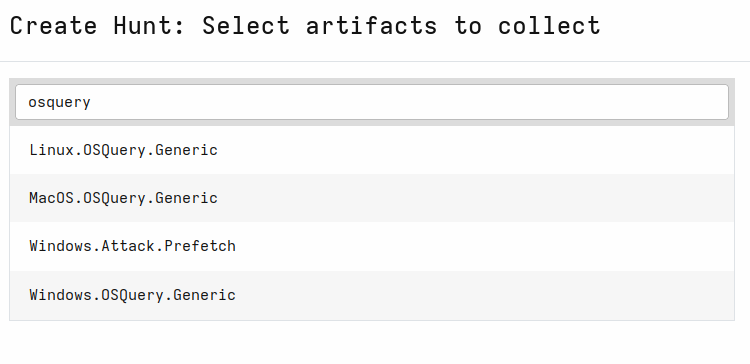
You can test this by powering down one of the Windows hosts, start hunt, and then power on the host while the hunt is still running. - Select artifacts you want to use.
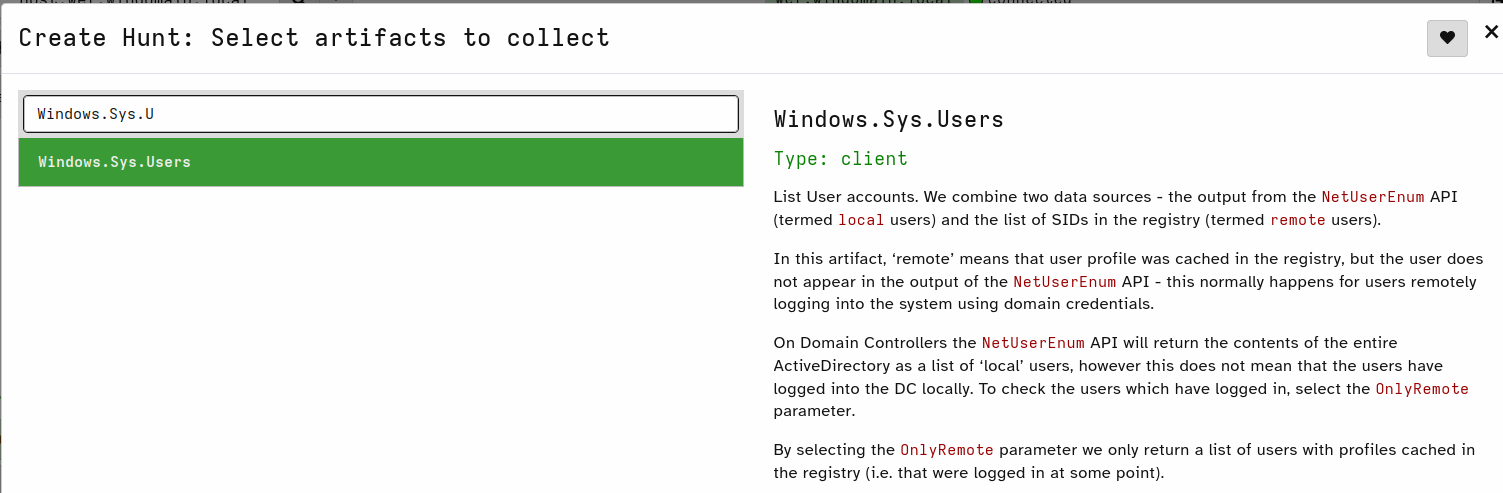
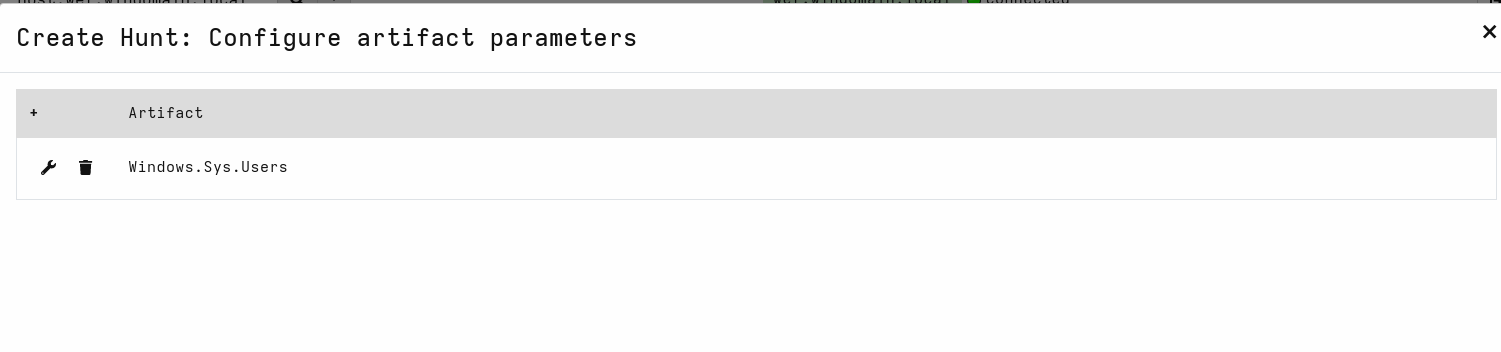
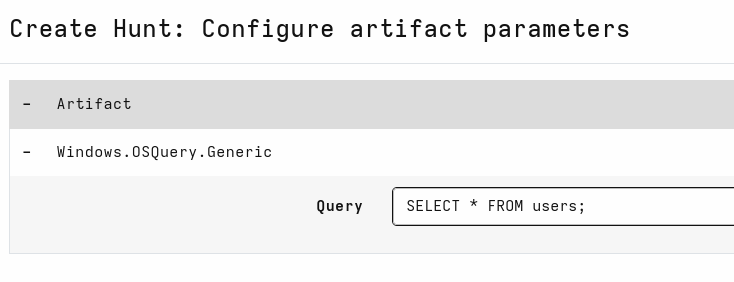
- Configure parameters for the selected artifacts. The need to configure something here depends on the artifact. You can configure parameters for an artifact by pressing the wrench icon.
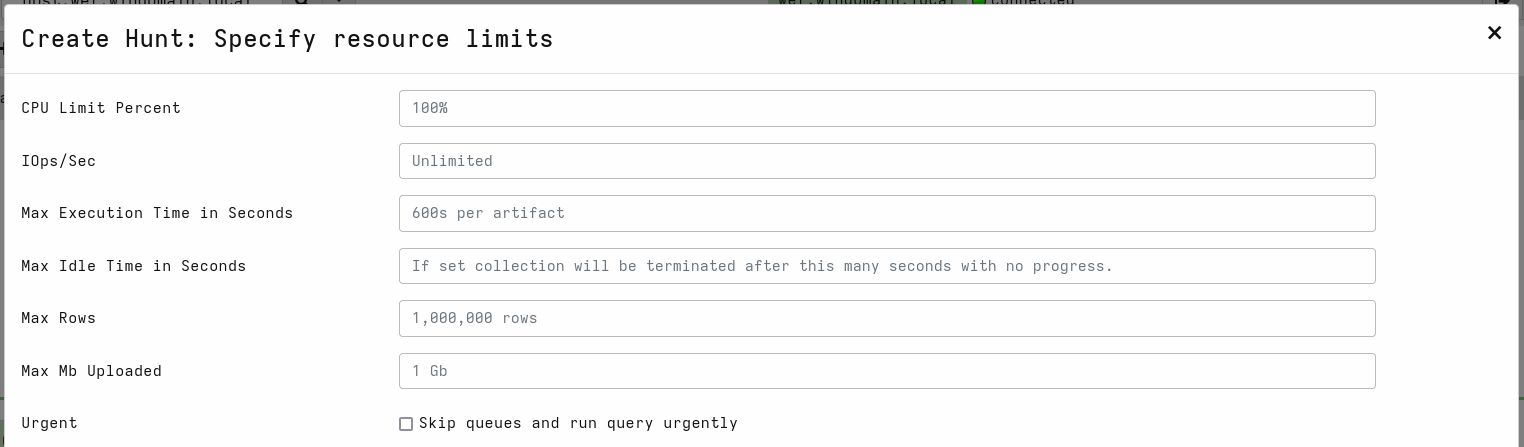
- Specify resource limits for the hunt.
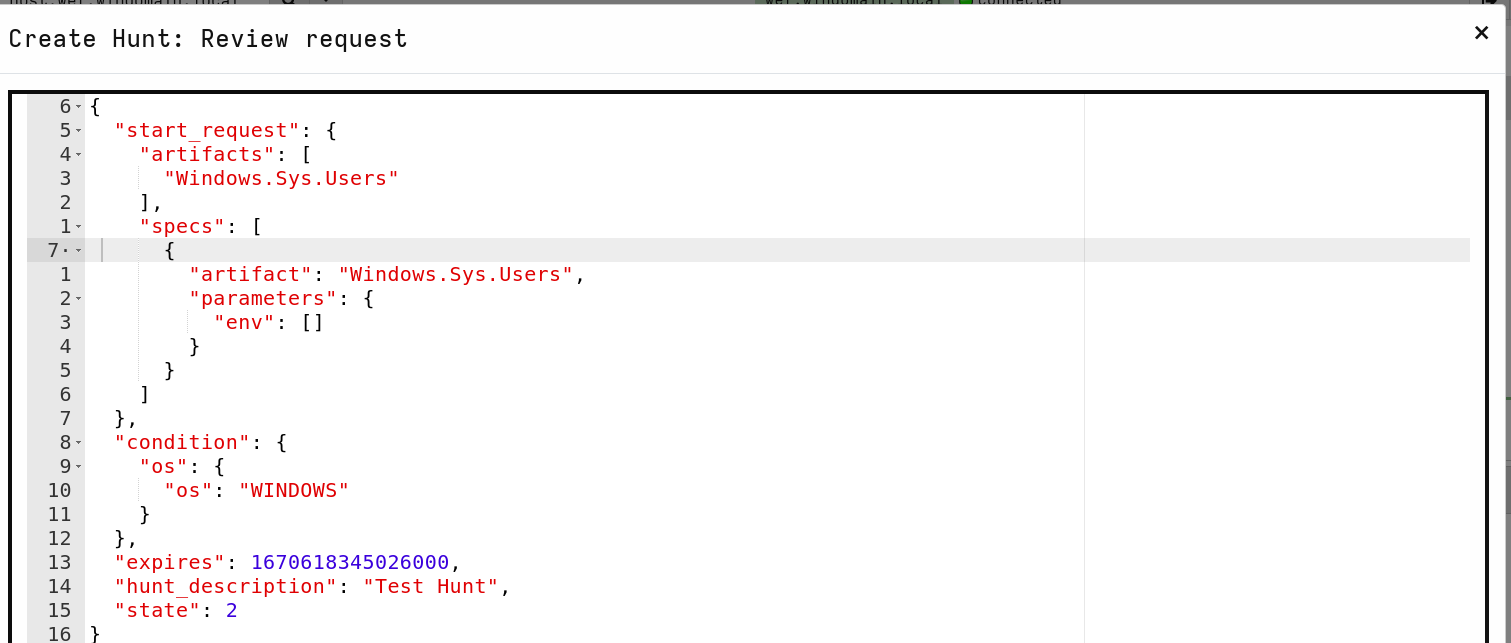
- Then you can review the hunt in JSON format.
- Then just select Launch. Note that after launching you still need to click the hunt and press the play button to start the hunt if you didn’t earlier select the option
Start Hunt Immediately.
You can investigate hunt results already while it’s running.
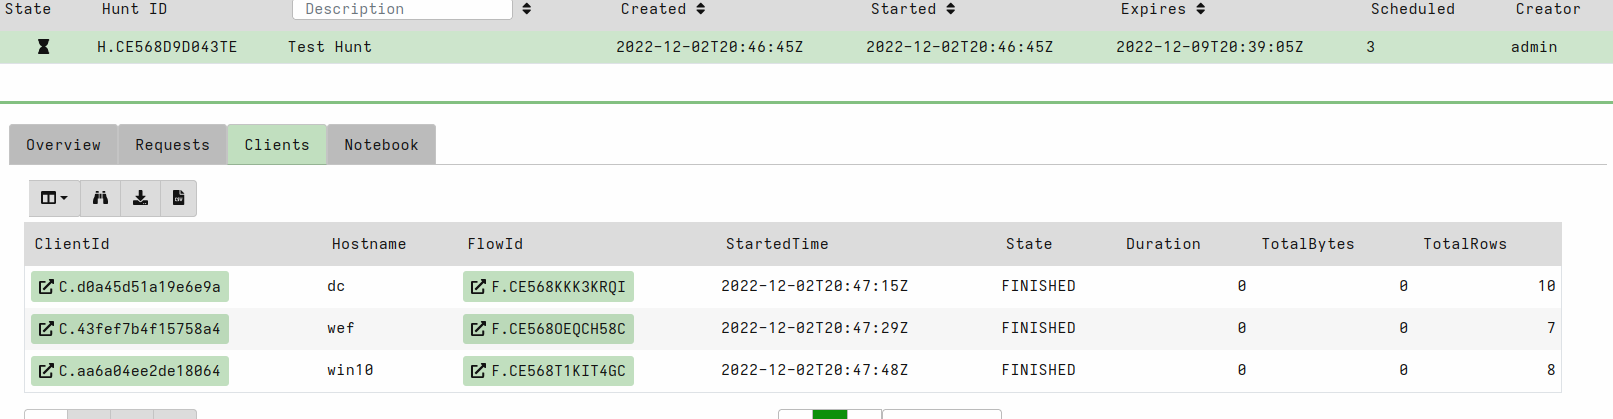
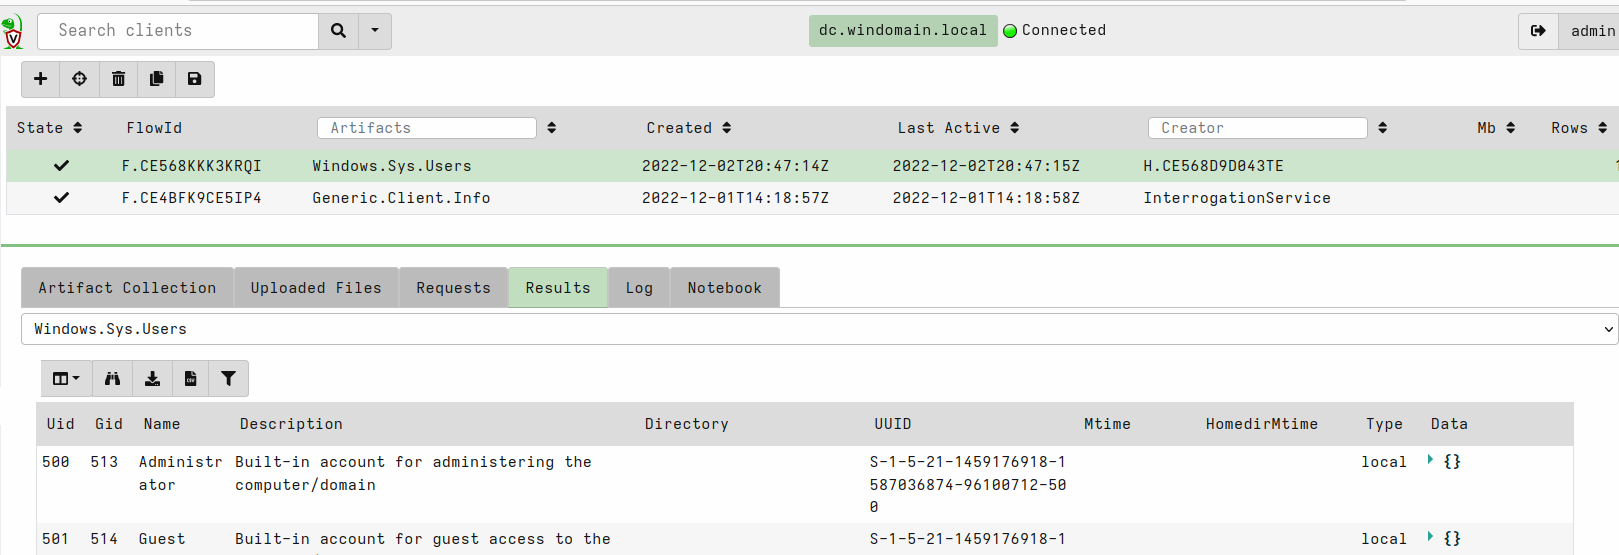
You can view the collected data by selecting a client that is finished (click the client id).
Velociraptor and OS query
You can also use OS query from Velociraptor by using OS query artifacts for different Operating Systems. Those artifacts will push the OS query binary to target hosts if it doesn’t exist yet.
See this blog post for more information: https://velociraptor.velocidex.com/velociraptor-and-osquery-2a4306dd23c.
RITA (Real Intelligence Threat Analytics)
RITA is an open source framework for network traffic analysis.
The framework ingests Zeek Logs in TSV format, and currently supports the following major features:
- Beaconing Detection: Search for signs of beaconing behavior in and out of your network
- DNS Tunneling Detection Search for signs of DNS based covert channels
- Blacklist Checking: Query blacklists to search for suspicious domains and hosts
– https://github.com/activecm/rita
Detecting DNS beacons with RITA
Create sample data
- Install dnsmasq to an external host:
apt install dnsmasq
- Modify
/etc/dnsmasq.conf:
no-resolv
no-hosts
address=/test.local/127.0.0.1
I’m using the physical host on which I run the DetectionLab, but you may want to use a separate virtual machine.
-
Restart dnsmasq:
systemctl restart dnsmasq -
Generate some DNS events on your Logger host that could look like beaconing traffic:
# Change IP of your dnsmasq server
DNS_SERVER=192.168.56.1
while true;do nslookup -timeout=5 -port=5353 $(tr -dc A-Za-z0-9 </dev/urandom | head -c 32|base64|tr -d '=' ).test.local $DNS_SERVER;sleep 5;done
- Capture traffic to PCAP file on your Logger host and let it run for some time (e.g. 5 minutes):
tcpdump -v -i eth1 -w /tmp/out.pcap
Search for beacons
- Install RITA to your Logger host using install.sh script:
bash install.sh --disable-zeek
# Using `--disable-zeek` because it's alreay installed in Logger host
- Modify
/etc/rita/config.yaml:
  InternalSubnets:
    - 10.0.0.0/8 # Private-Use Networks  RFC 1918
    - 172.16.0.0/12 # Private-Use Networks  RFC 1918
    #- 192.168.0.0/16 # Private-Use Networks  RFC 1918
    - 192.168.56.105/32
I wanted that the DNS server (192.168.56.1) is not interpreted as an internal host.
-
Stop nslookup loop on Logger.
-
Analyze PCAP with zeek:
mkdir -p /tmp/zeek_out && mv /tmp/out.pcap /tmp/zeek_out/ && cd /tmp/zeek_out/ && zeek -r out.pcap local "Log::default_rotation_interval = 1 day"
- Import data to RITA:
rita import /tmp/zeek_out/ test_dataset
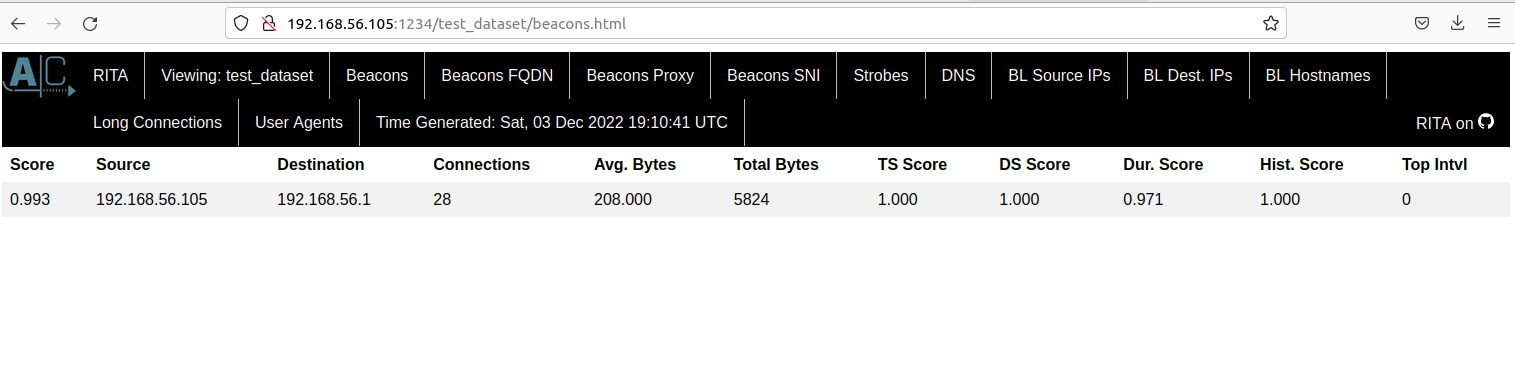
- Show beacons:
rita show-beacons test_dataset
Example output:
Score,Source IP,Destination IP,Connections,Avg. Bytes,Total Bytes,TS Score,DS Score,Dur Score,Hist Score,Top Intvl
0.993,192.168.56.105,192.168.56.1,28,208,5824,1,1,0.971,1,0
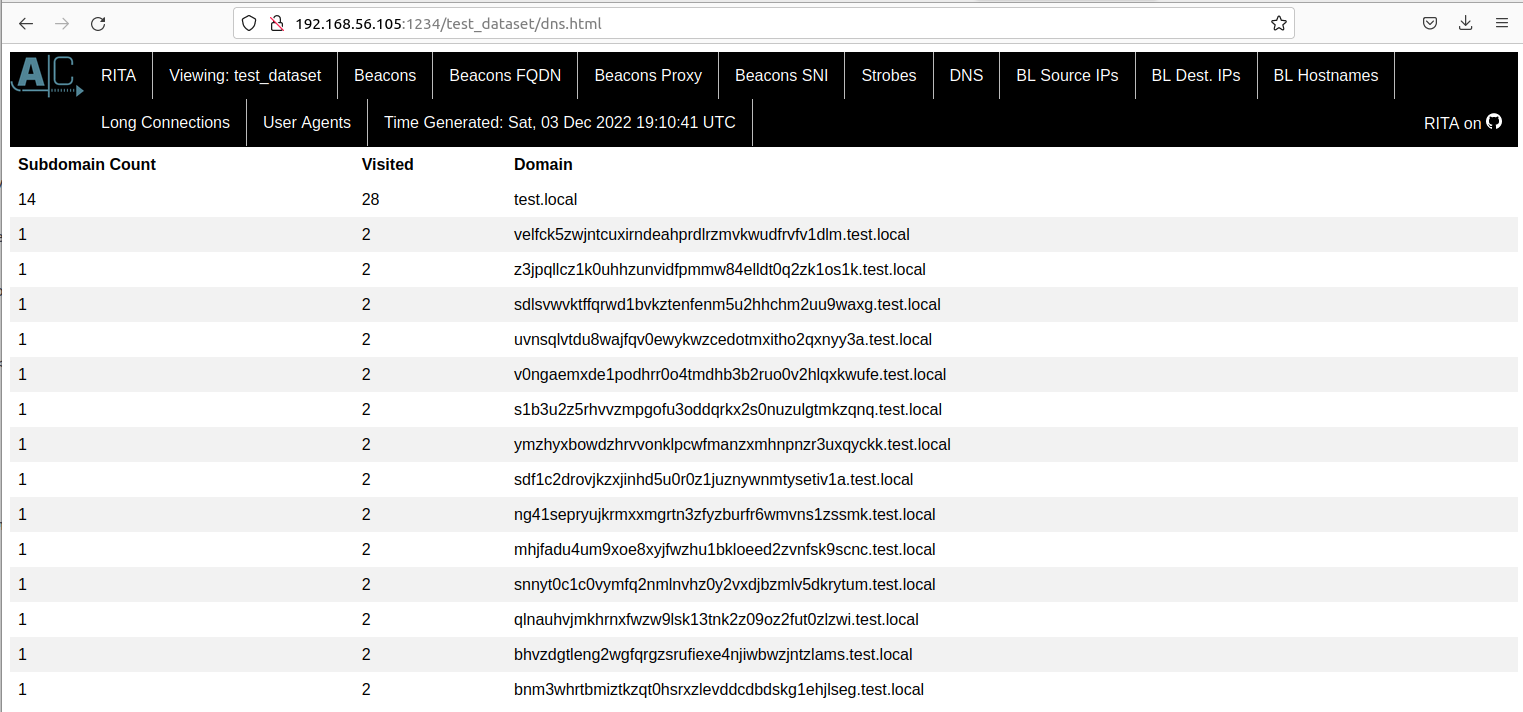
- Generate HTML report:
rita html-report test_dataset
- Serve report:
cd test_dataset/ && python3 -m http.server 1234
- Access report in you host’s browser by going to address http://192.168.56.105:1234/ and select Beacons.
Analyzing DetectionLab’s zeek logs
Capturing PCAP with tcpdump is not mandatory because DetectionLab has zeek preconfigured. I just wanted to write down examples for doing that as well.
- You can directly run data import against logs generated by the default zeek installation:
rita import /opt/zeek/spool/manager/ detection_lab
- Running
rita show-beacons detection_labshould show at least the same beacon event that was generated by the previous nslookup loop.