Wazuh - The Open Source Security Platform
This post contains some random things from my tests with the Wazuh platform. The way the project describes itself is:
The Open Source Security Platform
Unified XDR and SIEM protection for endpoints and cloud workloads.
– https://wazuh.com/
I installed Wazuh on top of Elastic stack. There some alternative installation methods that you can see here. Under the hood Wazuh also uses OSSEC. I had used OSSEC before so I had some idea how the things work and it was quite easy to grasp how Wazuh uses different components of OSSEC.
With my installation method Wazuh’s UI is built on top of Kibana which is part of the Elastic stack. Using Kibana is quite intuitive and there is a nice default alert dashboard that allows to start basic usage very quickly. The below screenshot is from the default security dashboard.
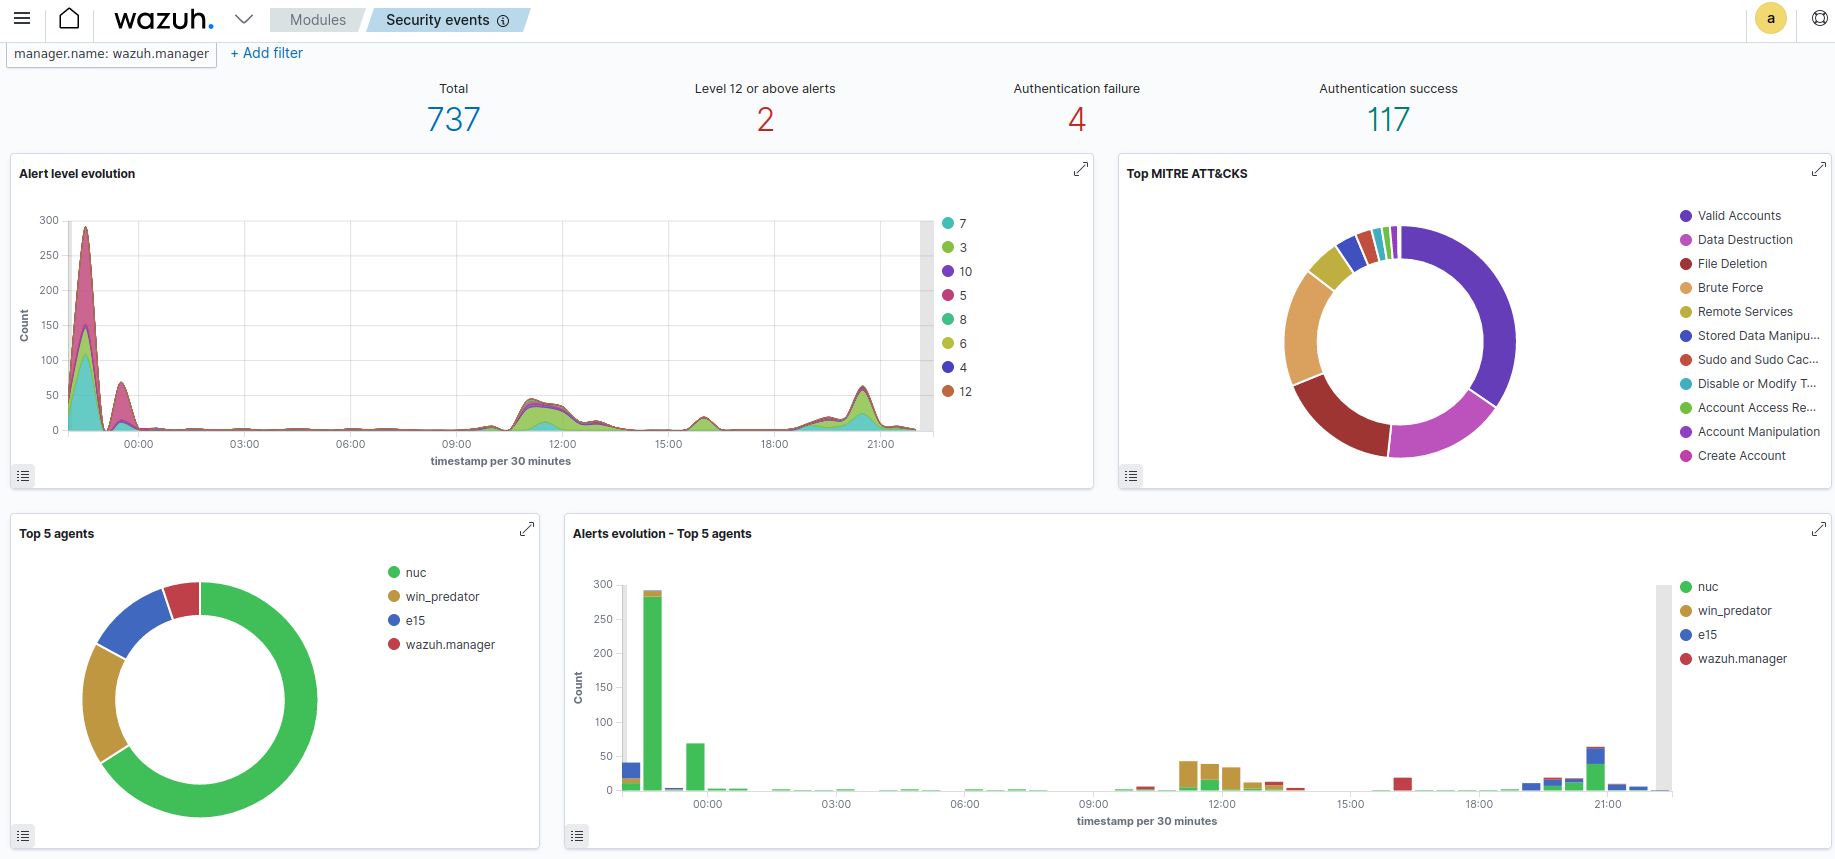
Below the dashboard you can scroll the actual alert events.
Agents and Groups
Wazuh has an agent component that is installed to the hosts you want to monitor. Agents can be organized to different groups and groups can have group specific configurations.
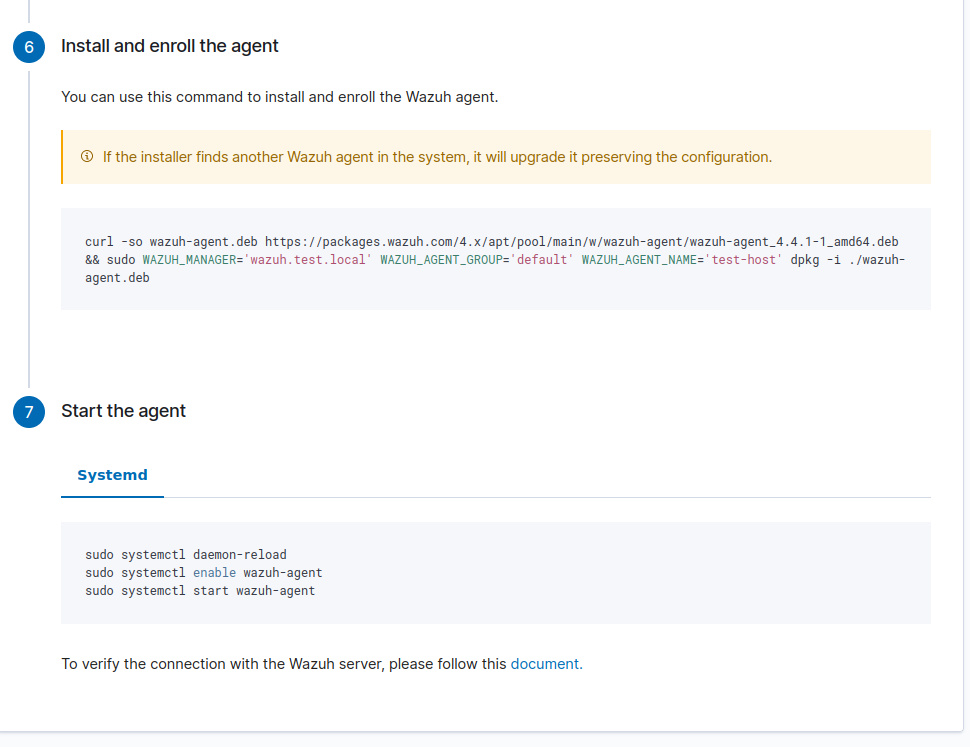
Wazuh UI has a simple form to deploy new agents. You just provide some relevant information and it will give you commands to deploy agents on the host.
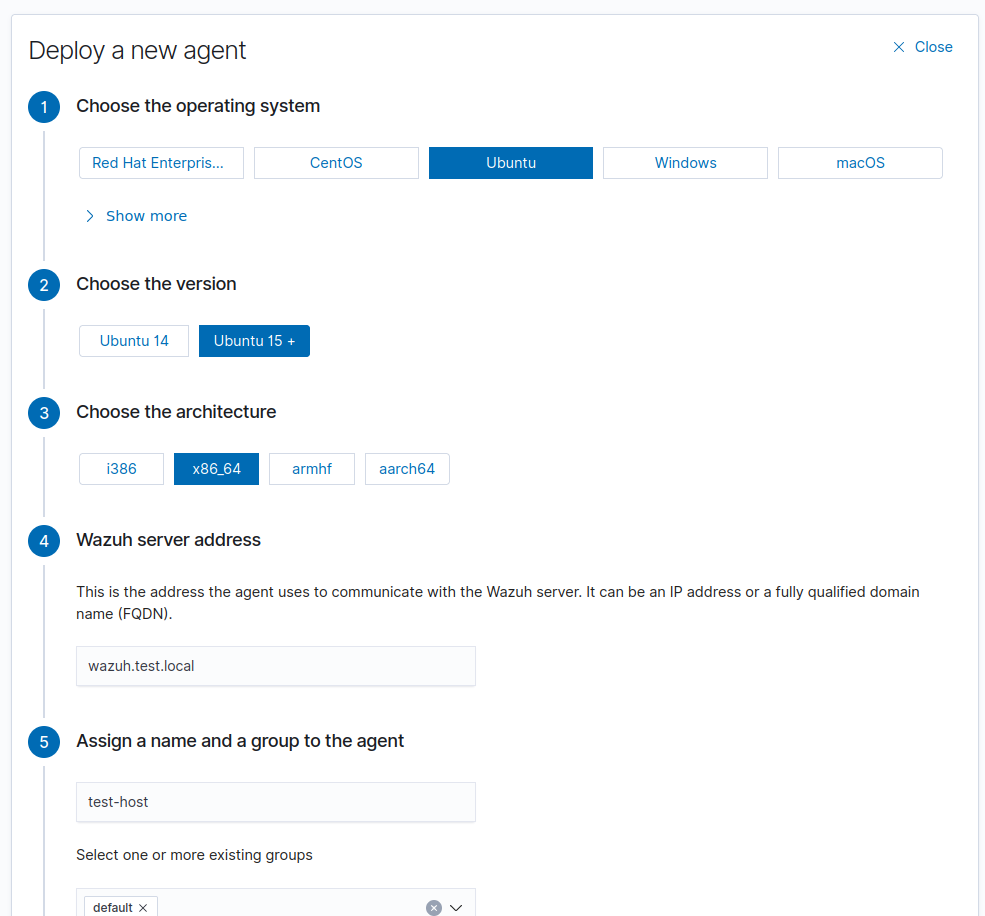
You can change agents’ group after the deployment without re-deploying the agent. This allows easily to make and fine tune logical structures based on different configuration needs.
It would also be really easy to automate this with Ansible or something so mass deployments should be quite easy.
File Integrity Monitoring (FIM)
Wazuh provides ability to monitor files’ integrity on the monitored hosts. You can read more about this here.
Malware hash detection
The idea for this is from Wazuh’s own documentation that can be found here. I won’t repeat everything shown in that document, but will show some minor things I had to modify to make this work and some thigs that I had to figure out.
I downloaded the VirusShare list (mentioned in documentation) from here. Then I used the script from the documentation, but ensured that each line is lowercase since the downloaded content was uppercase and Wazuh’s checksums are lowercase.
with open('VirusShare_0-449_MR4n6_Hash_Sets_RAW_2022_Q4.txt', 'r') as istr:
    with open('malware-hashes', 'w') as ostr:
        for i, line in enumerate(istr):
            if i > 5:
                line = line.rstrip('\n')
                line += ':'
                print(line.lower(), file=ostr)
The example rule in the documentation uses entry <list field="md5" lookup="match_key">etc/lists/malware-hashes</list> and I had a bit hard time understanding where the md5 field comes from. Events from syscheck module contains field syscheck.md5_after, but not md5.
Same thing with the field file as an event only had field syscheck.path.
Finally I found the answer from this document which explains how FIM fields are mapped to those fields.
To test this rule I added the eicar file’s checksum to the list: echo -n '<md5sum of eicar>:' >> malware-hashes (remember to restart wazuh manager)
Then I downloaded the file to a location that was monitored by wazuh-agent: cd /usr/sbin/ && sudo wget https://secure.eicar.org/eicar.com.txt && rm eicar.com.txt.
Finally, I increased the rule level as I really want to notice if malware is found somewhere. Otherwise the rule I use is the same as in the documentation.
<group name="local,malware,">
  <!-- https://wazuh.com/blog/detecting-and-responding-to-malicious-files-using-cdb-lists-and-active-response/ -->
  <rule id="100002" level="12">
    <if_sid>554</if_sid>
    <list field="md5" lookup="match_key">etc/lists/malware-hashes</list>
    <description>A file - $(file) - in the malware blacklist was added to the system.</description>
  </rule>
  <rule id="100003" level="12">
    <if_sid>100002</if_sid>
    <field name="file" type="pcre2">(?i)[c-z]:</field>
    <description>A file - $(file) - in the malware blacklist was added to the system.</description>
  </rule>
</group>

Monitoring Pfsense with Wazuh
Forwarding Pfsense logs to Wazuh
In Wazuh server’s rsyslog configuration I added the following:
/etc/rsyslog.d/30-pfsense.conf:
if $fromhost-ip startswith 'PFSENSE IP HERE' then /var/log/pfsense.log
& ~
Then I configured Pfsense to send logs to Wazuh server’s Rsyslog listener. This can be done directly from Pfsense’s Web GUI. Wazuh includes some decoders and alerts for Pfsense by default, so there’s no need to do anything to catch some basic things. For example, I have Snort configured in Pfsense and Wazuh has some working alert rules against Snort logs.
Detect successfull login events to Pfsense Web UI
Here is a custom decoder to parse loging events from Pfsense logs:
<decoder name="pfcustom_ui">
  <program_name>^php-fpm</program_name>
</decoder>

<decoder name="pfcustom_ui">
  <parent>pfcustom_ui</parent>
  <regex>/index.php: Successful login for user '(\.+)' from: (\d+.\d+.\d+.\d+) \(Local Database\)</regex>
  <order>pfsense.gui_login.username,pfsense.gui_login.srcip</order>
</decoder>
Then the rule:
 <!-- Pfsense creates two log lines for one login so ignore for 5 seconds -->
  <rule id="100037" level="12" ignore="5">
    <field name="pfsense.gui_login.username">\.+</field>
    <description>Pfsense UI login for user $(pfsense.gui_login.username) from $(pfsense.gui_login.srcip)</description>
    <group>authentication_success,</group>
  </rule>
I have the rule level quite high (12) as only logons I’m expecting are from myself and I have Slack integration that alerts from events equal or higher to 12.
Detect new MAC addresses doing DHCP discovery
My Pfsense firewall is acting as a DHCP server and I have configured it to log DHCP events. I created the following decoder to decode DHCP discovery events:
<decoder name="pfcustom">
  <program_name>^dhcpd</program_name>
</decoder>

<decoder name="pfcustom">
  <parent>pfcustom</parent>
  <regex>DHCPDISCOVER from (\S+) via (\.+)</regex>
  <order>pfsense.dhcp.requester_mac,pfsense.dhcp.server_interface</order>
</decoder>

<decoder name="pfcustom">
  <parent>pfcustom</parent>
  <regex>DHCPDISCOVER from (\S+) \((\.+)\) via (\.+)</regex>
  <order>pfsense.dhcp.requester_mac,pfsense.dhcp.requester_hostname,pfsense.dhcp.server_interface</order>
</decoder>
Then I created a new list file /var/ossec/etc/lists/known-macs with syntaz like this:
"11:22:33:44:55:66": "some device"
"11:22:33:44:55:77": "other device"
Finally, I created some custom rules to detect new MAC addresses in DHCP discovery:
  <rule id="100035" level="1">
    <field name="pfsense.dhcp.requester_mac">\.+</field>
    <description>DCHP discovery detected</description>
  </rule>

<rule id="100036" level="12" ignore="60">
    <if_sid>100035</if_sid>
    <list field="pfsense.dhcp.requester_mac" lookup="not_match_key">etc/lists/known-macs</list>
    <description>New MAC address detected in DHCP discovery</description>
</rule>
Custom Wireguard decoder and rules
I use Wireguard with my Pfsense firewall and the Wireguard package is a bit annoying when it comes to logging as it doesn’t do any.
I wanted to have some visibility with the Wireguard, but without logs I had to build something to monitor the traffic.
There is wg show command that shows some peer information, but at least the version my Pfsense has, doesn’t show peers’ public source address.
I decided to do a bit weird tcpdump apparoach to capture source IP’s from Wireguard traffic.
Below is a script that runs tcpdump for a 15 seconds, filters with Wireguard port, and parses unique IP addresses from the capture.
#!/bin/bash

export PATH=/sbin:/bin:/usr/sbin:/usr/bin:/usr/local/sbin:/usr/local/bin:/root/bin
# Set correct IP here
SERVER_PEER="IP of the 'server peer'"
IPS=$(timeout 15 tcpdump -n -i igb0 port 51820 2>&1 | grep -E '[0-9]{1,3}\.[0-9]{1,3}\.[0-9]{1,3}\.[0-9]{1,3}' -o | grep -v $SERVER_PEER|sort -u)
for i in  $(echo $IPS)
do
    logger -t wireguard -s "Wireguard traffic from src ip $i"
done
I use a cron job to run this script periodically. My Pfsense sends its system logs to a rsyslog server that has Wazuh agent installed and the agent collects those Pfsense logs. I just needed to add a custom decoder to parse these events:
<decoder name="wireguard">
    <program_name>^wireguard</program_name>
</decoder>

<decoder name="wireguard">
  <parent>wireguard</parent>
  <regex>Wireguard traffic from src ip (\d+.\d+.\d+.\d+)</regex>
  <order>srcip</order>
</decoder>
Then I added some rule to alert from Wireguard traffic:
<group name="wireguard,">
<rule id="100015" level="5">
    <program_name>wireguard</program_name>
    <description>Wireguard traffic from $(srcip)</description>
</rule>
</group>
This is far from perfect, or even a bit stupid, as the capture is not running constantly, so there are gaps in visibility, and it will capture non-valid Wireguard traffic if someone is just knocking the port (script doesn’t even specify UDP/TCP filter). It will also include Wireguard connections that are valid, so it will create false positives. I tried to create a condition based on the source’s geo location, but I was not able to make that work yet. It’s (maybe) better than nothing, but I would like to figure out something better in future. It still works as an example for a custom decoder and rule.
Active Responses
Wazuh allows configuring active responses for specific events or events above specific rule level. In practive active response is a script or executable that is executed by the Wazuh agent. There some default responses and you can also make your own. You can read more active responses here.
Isolate Linux endpoint
This is a simple example of how to perform isolation with a Linux host. It is far from bullet proof, but could potentially prevent some malware from spreading or slow down an attacker.
- Add script to Linux endpoint(s)
/var/ossec/active-response/bin/isolate.sh:
#!/bin/bash

# The script needs to allow connection to your dns server
# if you are using DNS in wazuh-agent configuration

WAZUH_SERVER="<WAZUH IP>"


if [[ "$1" = "restore" ]]
then
    iptables-restore < /root/.orig-iptables-rules
    chattr -i /root/.orig-iptables-rules
else
    iptables-save > /root/.orig-iptables-rules
    chattr +i /root/.orig-iptables-rules
    iptables -I OUTPUT -j REJECT
    iptables -I INPUT -j REJECT
    iptables -I INPUT -m conntrack --ctstate ESTABLISHED,RELATED -s "$WAZUH_SERVER" -j ACCEPT
    iptables -I OUTPUT -p tcp -d "$WAZUH_SERVER" --dport 443 -j ACCEPT
    iptables -I OUTPUT -p tcp -d "$WAZUH_SERVER" --dport 1514 -j ACCEPT
    iptables -I OUTPUT -p tcp -d "$WAZUH_SERVER" --dport 1515 -j ACCEPT
    iptables -I OUTPUT -p tcp -d "$WAZUH_SERVER" --dport 55000 -j ACCEPT
    # Logging the call
    echo "`date` $0 $1 $2 $3 $4 $5" >> ${PWD}/logs/active-responses.log
fi
-
chmod 755 /var/ossec/active-response/bin/isolate.sh -
Configure Wazuh server
/var/ossec/etc/ossec.conf(inside<ossec_config/>:
  <command>
    <name>linux-isolate</name>
    <executable>isolate.sh</executable>
    <timeout_allowed>yes</timeout_allowed>
  </command>

  <active-response>
    <command>linux-isolate</command>
    <location>local</location>
    <level>12</level>
    <timeout>600</timeout>
  </active-response>
This configures linux-isolate active response and it’s called when an alert with the level 12 or above is created.
- Run
systemctl restart wazuh-manageron the Wazuh server.
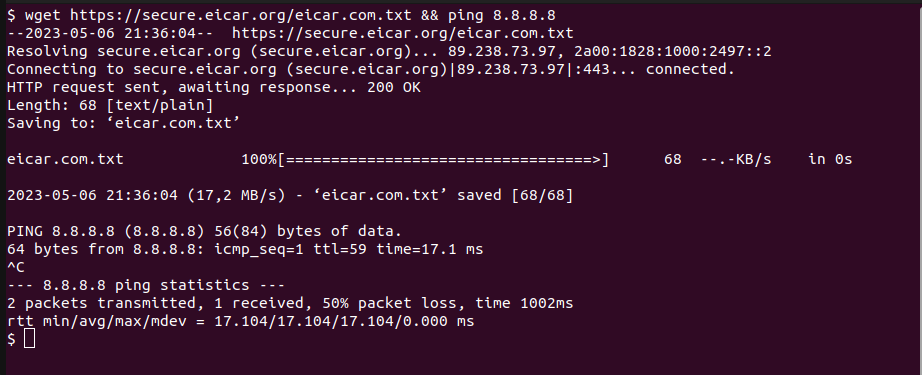
To test the configuration I will download the Eicar file which will create a level 12 alert with my current configuration.
After the download I execute ping 8.8.8.8 to see how quickly connections are dropped.
It’s possible to verify AR executions from endpoint’s /var/ossec/logs/active-responses.log file. One line in the log looks like this:
la 6.5.2023 21.53.19 +0300 active-response/bin/isolate.sh
To release a host from isolation I need to run /var/ossec/active-response/bin/isolate.sh restore on the host.
Retrieve snort pcap files when triggered by an IDS alert event
I would have wanted to enrich IDS alert with device information from /var/ossec/etc/lists/known-macs list, but I did not find sufficient way to do that with wazuh.
I decided to do an active response script that creates HTML reports with device and some public IP information when an alert hits.
To Pfsensen host I created a script /usr/local/bin/get_snort_logs.py:
#!/usr/local/bin/python3.11
import os
import sys
import glob
import datetime

INTERFACE = sys.argv[1]

listing = glob.glob(f'/var/log/snort/snort_{INTERFACE}*')
today = datetime.datetime.now().strftime('%Y-%m-%d')
for parent in listing:
    for i in os.listdir(parent):
        ts = os.path.getmtime(f'{parent}/{i}')
        mod_date = datetime.datetime.fromtimestamp(ts).strftime('%Y-%m-%d')
        if "snort.log" in i and os.stat(f'{parent}/{i}').st_size > 0 and today == mod_date:
            print(f'{parent}/{i}')
This searches for all snort pcap logs and prints out the ones that where modified at the same date as today. I did not create any custom Wazuh alerts as it has some built in rules for Snort.
Next I added the below script to /var/ossec/active-response/bin/get-snort-logs on Wazuh host.
The script does the following:
- Runs the created command
get_snort_logs.pyon the Pfsense host and uses SCP to retrieve pcap logst that were returned by theget_snort_logs.pycommand. - Outputs alert’s traffic.
- Checks if any MAC address associated with a private IP is in
/var/ossec/etc/lists/known-macsand outputs known devices. - Checks country etc. information for public IPs from ipinfo.io
The final result is HTML file per retrieved pcap log file. Result files are stored in /opt/snort_pcap_logs/. The script uses tcpdump, jq ,and tshark which needs to be installed.
Update <SET ME> parts to script and create PFSENSE_SSH* material. Ensure that wazuh user has access (e.g. chown -R wazuh:wazuh /usr/local/etc/pfsense_snort). Also change igb2 on line 15 to match the interface where snort is monitoring for. This is a current limitation with this setup that it doesn’t cover all interfaces, but
it could easily be changed. This was just enough for my current use-case.
#!/bin/bash

PFSENSE_USER="<SET ME>"
PFSENSE_IP="<SET ME>"
# https://ipinfo.io/
IP_INFO_API_KEY="<SET ME>"
PFSENSE_SSH_KEY="/usr/local/etc/pfsense_snort/pfsense_id_rsa"
PFSENSE_SSH_KNOWN_HOSTS="/usr/local/etc/pfsense_snort/known_hosts"
DIR="/opt/snort_pcap_logs/$(date '+%Y-%m-%d')"
# Create directory for today and cd into it
mkdir -p $DIR
cd $DIR

# Get snort logs with modification time of today
result=$(ssh -o UserKnownHostsFile=$PFSENSE_SSH_KNOWN_HOSTS -i $PFSENSE_SSH_KEY $PFSENSE_USER@$PFSENSE_IP '/usr/local/bin/get_snort_logs.py igb2')

# Copy snort logs to local host
for r in $result
do
    scp -o UserKnownHostsFile=$PFSENSE_SSH_KNOWN_HOSTS -i $PFSENSE_SSH_KEY $PFSENSE_USER@$PFSENSE_IP:$r .
    echo "<h1>Traffic from file $(basename $r)</h1>" > $(basename $r).html
    echo '<pre><code>' >> $(basename $r).html
    tcpdump -n -r $(basename $r) >> $(basename $r).html
    echo '</code></pre>' >> $(basename $r).html

    # Find known devices from known_macs list
    SEEN_MACS=()
    SEEN_IPS=()
    echo '<h1>Known devices</h1>' >> $(basename $r).html
    echo '<ul>' >> $(basename $r).html
    for i in $(tshark -r snort.log.1693613945 -T fields -e eth.src -e ip.src -e eth.dst -e ip.dst -E separator=,)
    do
        SRC_MAC=$(echo $i|awk -F ',' '{print $1}')
        SRC_IP=$(echo $i|awk -F ',' '{print $2}')
        DST_MAC=$(echo $i|awk -F ',' '{print $3}')
        DST_IP=$(echo $i|awk -F ',' '{print $4}')
        if [[ ! " ${SEEN_MACS[*]} " =~ " ${SRC_MAC} " && $(echo $SRC_IP | grep -E '^(192\.168|10\.|172\.1[6789]\.|172\.2[0-9]\.|172\.3[01]\.)' | wc -l) -gt 0 ]]; then
            SEEN_MACS+=("$SRC_MAC")
            mac_known=$(grep $SRC_MAC /var/ossec/etc/lists/known-macs)
            if [[ $(echo $mac_known|wc -l) -gt 0 ]]
            then
                echo "<li>$(echo $mac_known|awk -F '\":' '{print $2}'|tr -d '\"') ($SRC_IP)</li>" >> $(basename $r).html
            fi
        fi
        if [[ ! " ${SEEN_MACS[*]} " =~ " ${DST_MAC} " && $(echo $DST_IP | grep -E '^(192\.168|10\.|172\.1[6789]\.|172\.2[0-9]\.|172\.3[01]\.)' | wc -l) -gt 0 ]]; then
            SEEN_MACS+=("$DST_MAC")
            mac_known=$(grep $DST_MAC /var/ossec/etc/lists/known-macs)
            if [[ $(echo $mac_known|wc -l) -gt 0 ]]
            then
                echo "<li>$(echo $mac_known|awk -F '\":' '{print $2}'|tr -d '\"') ($DST_IP)</li>" >> $(basename $r).html
            fi
        fi
    done
    echo '</ul>' >> $(basename $r).html
    for i in $(tshark -r snort.log.1693613945 -T fields -e eth.src -e ip.src -e eth.dst -e ip.dst -E separator=,)
    do
        SRC_MAC=$(echo $i|awk -F ',' '{print $1}')
        SRC_IP=$(echo $i|awk -F ',' '{print $2}')
        DST_MAC=$(echo $i|awk -F ',' '{print $3}')
        DST_IP=$(echo $i|awk -F ',' '{print $4}')
        # Get IP information for public IP addresses
        if [[ ! " ${SEEN_IPS[*]} " =~ " ${SRC_IP} " && $(echo $SRC_IP | grep -E '^(192\.168|10\.|172\.1[6789]\.|172\.2[0-9]\.|172\.3[01]\.)' | wc -l) -eq 0 ]];then
            SEEN_IPS+=("$SRC_IP")
            ip_info=$(curl -H "Authorization: Bearer $IP_INFO_API_KEY" -H "Accept: application/json" https://ipinfo.io/$SRC_IP)
            echo "<h1>IP information for $SRC_IP</h1>" >> $(basename $r).html
            echo '<ul>' >> $(basename $r).html
            echo "<li>Org: $(echo $ip_info|jq '."org"')</li>" >> $(basename $r).html
            echo "<li>Country: $(echo $ip_info|jq '."country"')</li>" >> $(basename $r).html
            echo "<li>City: $(echo $ip_info|jq '."city"')</li>" >> $(basename $r).html
            echo "<li>Region: $(echo $ip_info|jq '."region"')</li>" >> $(basename $r).html
            echo "<li>Loc: $(echo $ip_info|jq '."loc"')</li>" >> $(basename $r).html
            echo "<li>Hostname: $(echo $ip_info|jq '."hostname"')</li>" >> $(basename $r).html
            echo '</ul>' >> $(basename $r).html
        fi
        if [[ ! " ${SEEN_IPS[*]} " =~ " ${DST_IP} " && $(echo $DST_IP | grep -E '^(192\.168|10\.|172\.1[6789]\.|172\.2[0-9]\.|172\.3[01]\.)' | wc -l) -eq 0 ]]; then
            SEEN_IPS+=("$DST_IP")
            ip_info=$(curl -H "Authorization: Bearer $IP_INFO_API_KEY" -H "Accept: application/json" https://ipinfo.io/$DST_IP)
            echo "<h1>IP information for $DST_IP</h1>" >> $(basename $r).html
            echo '<ul>' >> $(basename $r).html
            echo "<li>Org: $(echo $ip_info|jq '."org"')</li>" >> $(basename $r).html
            echo "<li>Country: $(echo $ip_info|jq '."country"')</li>" >> $(basename $r).html
            echo "<li>City: $(echo $ip_info|jq '."city"')</li>" >> $(basename $r).html
            echo "<li>Region: $(echo $ip_info|jq '."region"')</li>" >> $(basename $r).html
            echo "<li>Loc: $(echo $ip_info|jq '."loc"')</li>" >> $(basename $r).html
            echo "<li>Hostname: $(echo $ip_info|jq '."hostname"')</li>" >> $(basename $r).html
            echo '</ul>' >> $(basename $r).html
        fi
    done
done

# Logging the call
echo "`date` $0 $1 $2 $3 $4 $5" >> /var/ossec/logs/active-responses.log
Finally add active response configuration to /var/ossec/etc/ossec.conf on the Wazuh host:
  <command>
    <name>get-snort-logs</name>
    <executable>get-snort-logs</executable>
    <timeout_allowed>yes</timeout_allowed>
  </command>

  <active-response>
    <disabled>no</disabled>
    <command>get-snort-logs</command>
    <location>server</location>
    <rules_group>ids</rules_group>
    <timeout>600</timeout>
  </active-response>
One way to test that wazuh can run the script is to su -s /bin/bash wazuh, then cd /var/ossec/ and ./active-response/bin/get-snort-logs.
I also created a simple nginx config to view HTML reports:
server {
  listen        80 default_server;

  location / {
    autoindex on;
    root  /opt/snort_pcap_logs/;
  }
}
Just ensure that Wazuh and Nginx has access to /opt/snort_pcap_logs/ and that Nginx can read the reports. This may work out of the box, but depending on your umask configuration you may need to modify the script to chmod correct permissions for files and directories.
When the script runs the end result should look something like this:
 ls -la /opt/snort_pcap_logs/2023-09-02/
total 84
drwxr-xr-x 2 wazuh www-data  4096 Sep  2 18:10 .
drwxr-xr-x 3 wazuh www-data  4096 Sep  2 13:55 ..
-rw------- 1 wazuh www-data  4572 Sep  2 18:09 snort.log.1693613945
-rw-r--r-- 1 wazuh www-data  5020 Sep  2 18:09 snort.log.1693613945.html
-rw------- 1 wazuh www-data 31188 Sep  2 18:09 snort.log.1693614211
-rw-r--r-- 1 wazuh www-data 26070 Sep  2 18:09 snort.log.1693614211.html
Pfsense and Suricata
There doesn’t seem to be built-in decoder for suricata alerts if you are using it instead of snort. The only difference with logging from snort is the program name in syslog messages. Easy solution for this is to copy built-in snort decoder and just replace “snort” with “suricata”.
<decoder name="suricata">
  <program_name>^suricata</program_name>
</decoder>

<decoder name="suricata">
  <type>ids</type>
  <prematch>^[**] [\d+:\d+:\d+] </prematch>
</decoder>

<decoder name="suricata2">
   <parent>suricata</parent>
   <type>ids</type>
   <prematch>^[**] |^[\d+:\d+:\d+] </prematch>
   <regex>^[**] [(\d+:\d+:\d+)] \.+ (\S+)\p*\d* -> </regex>
   <regex>(\S+)|^[(\d+:\d+:\d+)] \.+ </regex>
   <regex>(\S+)\p*\d* -> (\S+)</regex>
   <order>id,srcip,dstip</order>
   <fts>name,id,srcip,dstip</fts>
</decoder>
After this, same IDS rules that are generated from Snort alerts should work with Suricata events.
Wazuh also has examples here for parsing Suricata’s JSON formatted eve logs.
Monitoring USB events with USBGuard
I run USBGuard on Linux workstations and wanted to get alerts when an unauthorized device is connected.
I created the following decoder for USBGuard logs:
<decoder name="usbguard">
  <program_name>^usbguard-daemon</program_name>
</decoder>

<decoder name="usbguard">
  <parent>usbguard</parent>
  <regex>result='(\w+)' device.system_name='(\.+)' target.new='(\w+)' device.rule='(\.+)'</regex>
  <order>usbguard.result,usbguard.device.system_name,usbguard.target.new,usbguard.device.rule</order>
</decoder>
Then the following rule:
<group name="ubs,usbguard,">
<rule id="100031" level="10">
    <field name="usbguard.target.new">block</field>
    <description>Unauthorized USB device detected</description>
</rule>
</group>
Wazuh already has 0375-usb_rules.xml which has events for attached USB devices, so for me it was enough to create a rule to alert when unauthorized device is attached.
Wazuh also has a blog bost about monitoring USB devices with Windows if you are interested in that: https://wazuh.com/blog/monitoring-usb-drives-in-windows-using-wazuh/.
Other tips & tricks
MISP integration
I didn’t have MISP instance to test this and was too lazy to setup one for now, but here’s an interesting blog post that explains how to enrich Wazuh alerts with MISP data: https://opensecure.medium.com/wazuh-and-misp-integration-242dfa2f2e19.
If ip in subnet
I had a bit hard time accepting that Wazuh didn’t have any pre-defined rule syntax to test if an IP is part of a subnet, but it seems to be the case. There were many cases where I wanted to test if some IP was part of a specific subnet and the best way to accomplish this seems to be CBD lists.
As you can find from the linked documentation, Wazuh’s CBD lists has a special dot notation to match subnets. Creating lists for each network I wanted to use in my rules allowed to <if ip in subnet> like checks.
Reducing noise
There are (at least) two ways to reduce alerts from noisy rules. First is overwrite the whole rule and set its rule level to zero. This will silence all alerts from the rule.
  <rule id="80730" level="0" overwrite="yes">
    <if_sid>80700</if_sid>
    <field name="audit.type">AVC</field>
    <description>Auditd: SELinux permission check.</description>
    <group>audit_selinux,gdpr_IV_30.1.g,gdpr_IV_35.7.d,hipaa_164.312.b,nist_800_53_AU.6,pci_dss_10.6.1,tsc_CC7.2,tsc_CC7.3,</group>
  </rule>
You just copy the whole rule and important thing to set is level="0" overwrite="yes".
It’s also possible to silence alerts based on some conditions.
Just create a new rule with the relevant if_sid. Then specify correct conditions and set rule level to zero. This way you can reduce some noise without disabling the whole rule.
<rule id="100010" level="0">
    <if_sid>87702</if_sid>
    <list field="srcip" lookup="address_match_key">etc/lists/trusted_src_ips</list>
    <description>Rule muted when the srcip is in the trusted source IP list</description>
</rule>
I also had a one clear false positive from the rootcheck module:
Trojaned version of file '/usr/bin/diff' detected. Signature used: 'bash|^/bin/sh|file\.h|proc\.h|/dev/[^n]|^/bin/.*sh' (Generic).
I found a fix for this from Github.
-diff        !bash|^/bin/sh|file\.h|proc\.h|/dev/[^n]|^/bin/.*sh!
+diff        !bash|^/bin/sh|file\.h|proc\.h|/dev/[^nf]|^/bin/.*sh!