Monitoring Ruuvi tags with Raspberry Pi (part 2)
This post continues with the topic of the previous post where I created a small Flask based API and User Interface to view Ruuvi tag data. I continue with the Flask based API concept, but now it can be used as a data source for Grafana. I made a small app which I unimaginatively named as RuuviPi. This provides an API which from Grafana can pull Ruuvi tag data and visualize it.
There really is nothing Raspberry Pi specific in this, so technically you can use any Linux distribution and hardware. However, to follow all commands, it has to be some Debian flavored distro. I have tested everything with Raspberry Pi model 3 running Raspbian lite OS.
The end goal is to deploy the RuuviPi API as systemd service and visualize some Ruuvi data in Grafana.
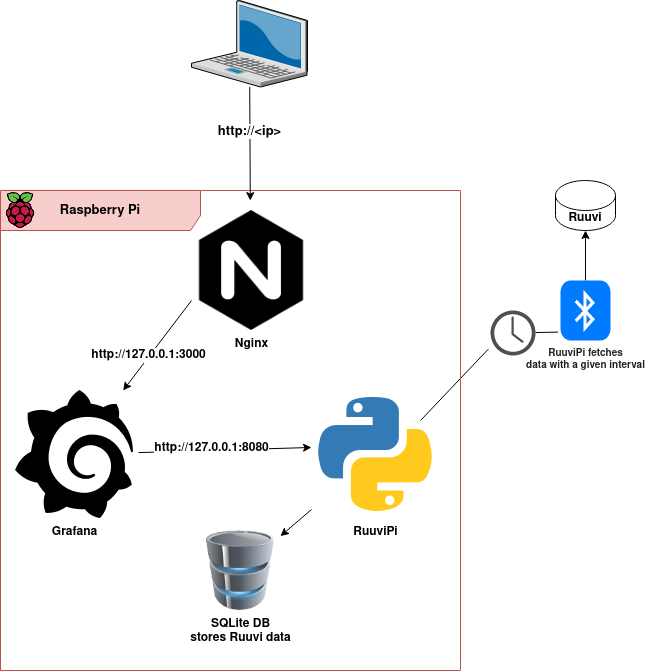
The architecture is going to look like this:
Initial setup
Like in the previous post, the expected starting point is to have Raspberry Pi running and you are able access it e.g. via SSH. Following this post does not expect any setup done in the previous part.
Every command and configuration done in this post are meant to be done in your Raspberry Pi.
Install dependencies
- Bluetooth tools
sudo apt install bluez bluez-hcidump
- Python dependencies
sudo apt-get install python3-pip
pip3 install ruuvitag_sensor flask python-dateutil gunicorn
Note that the ruuvitag_sensor library, which does all the hard work here, spawns sudo processes to extract Bluetooth data with hcitool command.
Meaning that unless you allow all sudo commands without providing password then the user running the app should have NOPASSWD for the hcitool. For example:
pi ALL=NOPASSWD: /usr/bin/hcitool
Deploy RuuviPi
Installation
Download the app from Github and extract it into some place you like. In the below example I’m using pi user’s home directory.
Remember to change you paths in other steps if you are using something else.
cd /home/pi/
wget -O ruuvipi.zip https://github.com/mtask/RuuviPi/archive/main.zip
unzip ruuvipi.zip
Configuration
Open (vi(m)/nano) /home/pi/RuuviPi-main/src/instance/conf.py and change the following:
- Configure
TAGSto include MAC address of your Ruuvi tag as value for “text” and “value” keys. Use the same format with MACs that has been used in the example. You can add multiple tags by just adding new dictionary to list. E.g.TAGS = [ { "text": "e4c7751d5230", "value": "e4c7751d5230"}, { "text": "e4c7751d5231", "value": "e4c7751d5231"} ] - Specify data that you want to use from Ruuvi’s sensors in
DATA_COLUMNS. Options are time, data_format, humidity, temperature, pressure, acceleration, acceleration_x, acceleration_y, acceleration_z, tx_power, battery, movement_counter, measurement_sequence_number, and mac. - Set some suitable database filepath in
DATABASE. Only restriction is that the path needs to be writable for the user that is running the app. DATA_FETCH_DELAYspecifies in seconds how often the app queries data from Ruuvi tag(s).LOG_FILEspecifies an absolute path for the app to write logging events. If not specified then the app writes logging events to console.
Test the API
Now you can cd into /home/pi/RuuviPi-main/src/ and run python3 ruuviDataSource.py.
This should start Flask development server. While keeping the app running you can run curl -I http://127.0.0.1:8080/ and check that you get HTTP/1.1 200 OK response.
Run the API as Systemd service
Create the following Systemd unit file /etc/systemd/system/ruuvipi.service (requires sudo/root) and add the below content.
[Unit]
Description=RuuviPi service
After=network.target

[Service]
# the specific user that our service will run as
User=pi
Group=pi
RuntimeDirectory=gunicorn
WorkingDirectory=/home/pi/RuuviPi-main/src/
ExecStart=/home/pi/.local/bin/gunicorn --bind 127.0.0.1:8080 wsgi:app
ExecReload=/bin/kill -s HUP $MAINPID
KillMode=mixed
TimeoutStopSec=5
PrivateTmp=true

[Install]
WantedBy=multi-user.target
Use which gunicorn command to check gunicorn’s location and set the correct value in ExecStart= row.
With a different user than the pi user in User= section, ensure that the user has permissions to access RuuviPi files. Usually you would want to use seperate service account without shell access.
Run the following commands to enable and start the service. First, ensure that you are not running the API manually anymore.
sudo systemctl daemon-reload
sudo systemctl start ruuvipi.service
sudo systemctl enabl ruuvipi.service
Now if you check sudo systemctl status ruuvipi.service it should show that the service is active (running).
If it’s not running then check sudo journalctl -f -u ruuvipi.service and the specified log file for any errors.
Deploy Grafana
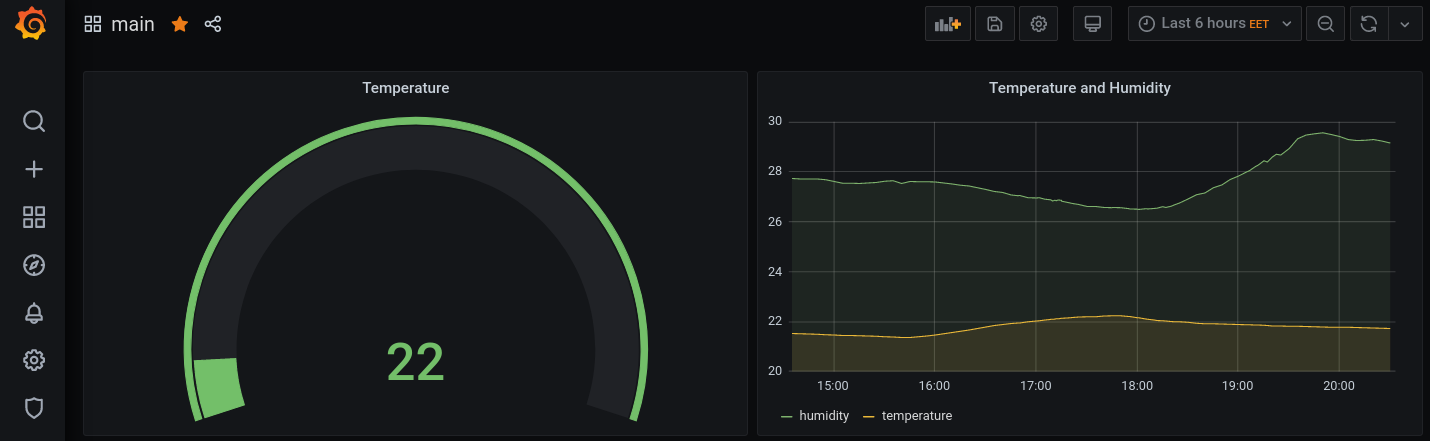
I’m pretty new to Grafana myself, so I’m just showing a simple dashboard and panel, which I have been using for testing. The RuuviPi API currently supports the table data format and not the time-series. I’m not quite sure if there’s any good reason to add support for time-series as the table format seems to be enough for what I need.
Installation
Run the following commands to install Grafana and JSON plugin. The JSON plugin provides the ability to visualize Ruuvi tag data from RuuviPi API.
wget -q -O - https://packages.grafana.com/gpg.key | sudo apt-key add -
echo "deb https://packages.grafana.com/oss/deb stable main" | sudo tee -a /etc/apt/sources.list.d/grafana.list
sudo apt-get update
sudo apt-get install -y grafana
sudo systemctl enable grafana-server
sudo systemctl start grafana-server
#Run "curl -I http://127.0.0.1:3000" and check that you get 302 redirect to "/login"
sudo grafana-cli plugins install simpod-json-datasource
sudo systemctl restart grafana-server
Grafana should now answer in http://<Pi's IP>:3000 and login credentials are admin:admin. The first login prompts to change the password.
Configuration
Create Data Source
- Log in to Grafana
- Select “Configuration” –> “Data Sources” –> “Add data source”
- Search for “JSON” and select it
- Give it name “Ruuvi” and configuration like in the below image
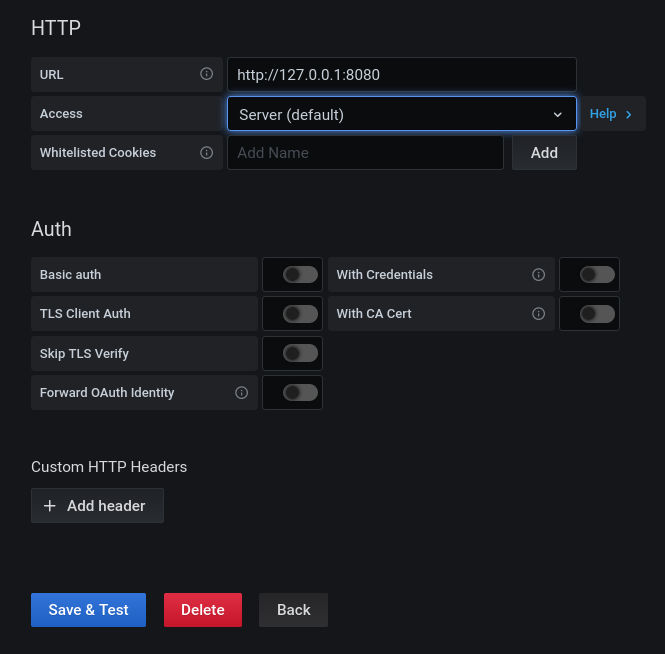
- “Save and Test”
- You should see a green pop-up saying “Data source is working”
Create Dashboard and Panel
- Select “+” –> “Dashboard”
- Select “+ Add new panel”
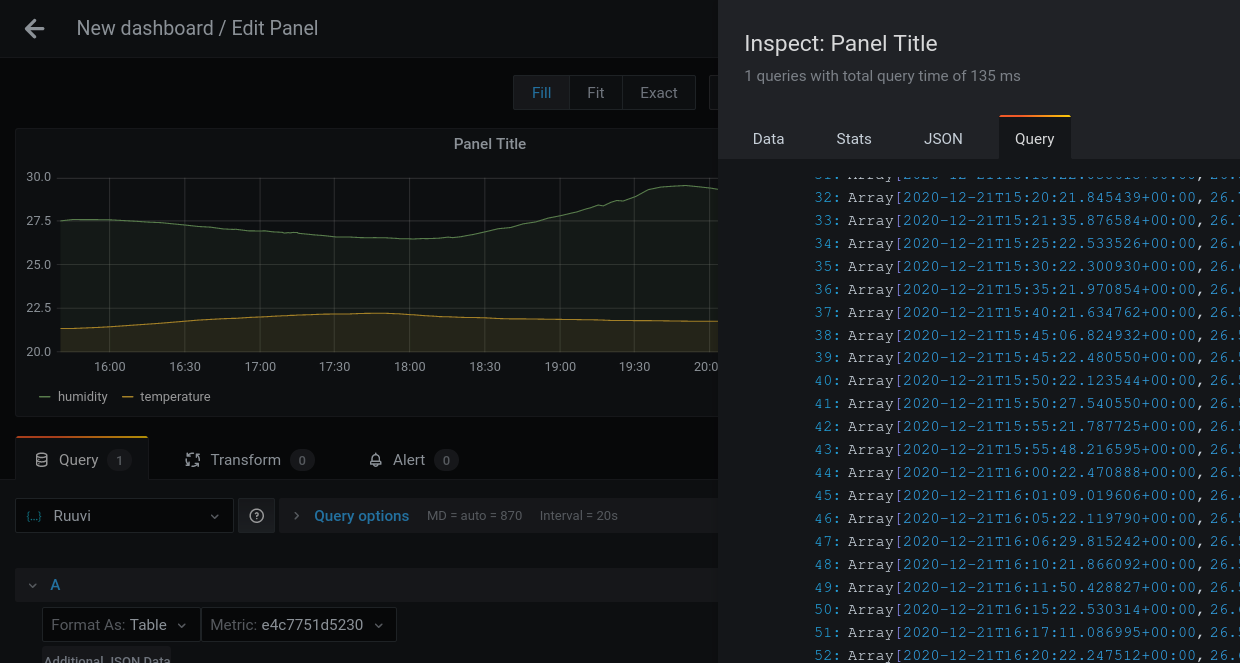
- Select “Ruuvi” data source.
- Under series “A” select “Format As: Table”
- Select your Ruuvi tag in “Metric”
- There’s an issue with the
/searchendpoint of RuuviPi if you don’t see tag(s) here. - You can use
curl -X POST http://127.0.0.1:8080/searchcommand to verify that the API returns something like[{"text":"e4c7751d5230","value":"e4c7751d5230"}].
- There’s an issue with the
- Select “Query Inspector” and hit “Refresh”
- In the bottom part of the Query Inspector you should see response from RuuviPi that includes tag’s data.
- You should also see some data visualized in the panel already.
- Save the panel and the dashboard
Deploy Nginx
I’m using Nginx as a reverse proxy in front of Grafana. The example configuration will be for plaintext HTTP without involving domain names, but HTTPS is always recommended. Check this if you want to see examples for HTTPS configuration.
Installation
sudo apt install nginx
Configuration
Create file /etc/nginx/sites-enabled/<you-raspbery-pi-IP> and add the below content.
Ensure that you change <you-raspbery-pi-IP> part with the actual IP address of your Pi.
server {
  listen 80;
  server_name <you-raspbery-pi-IP>;
  server_tokens off;

  location / {
   proxy_pass http://localhost:3000/;
  }
}
Edit /etc/grafana/grafana.ini file and add line domain = <you-raspbery-pi-IP> under [server] section.
Restart Grafana and Nginx.
sudo systemctl restart grafana-server
sudo systemctl restart nginx
As a final touch I will setup UFW firewall and allow only SSH and HTTP in.
sudo apt install ufw
sudo ufw default allow outgoing
sudo ufw default deny incoming
sudo ufw allow ssh
sudo ufw allow http
sudo ufw enable # press y
Now you should be able to access Grafana through http://<your Pi's IP>.